 Little Bird Trading
 SPY, DAX +18 Global Market Levels: Sept 21-25 Week in Review
By Lee H. · · 3 min read
A mixed week across the US, Asia, Europe and Latin America: 14 of 23 finished higher, with the week's low on Thursday, September 24.
How each one played out
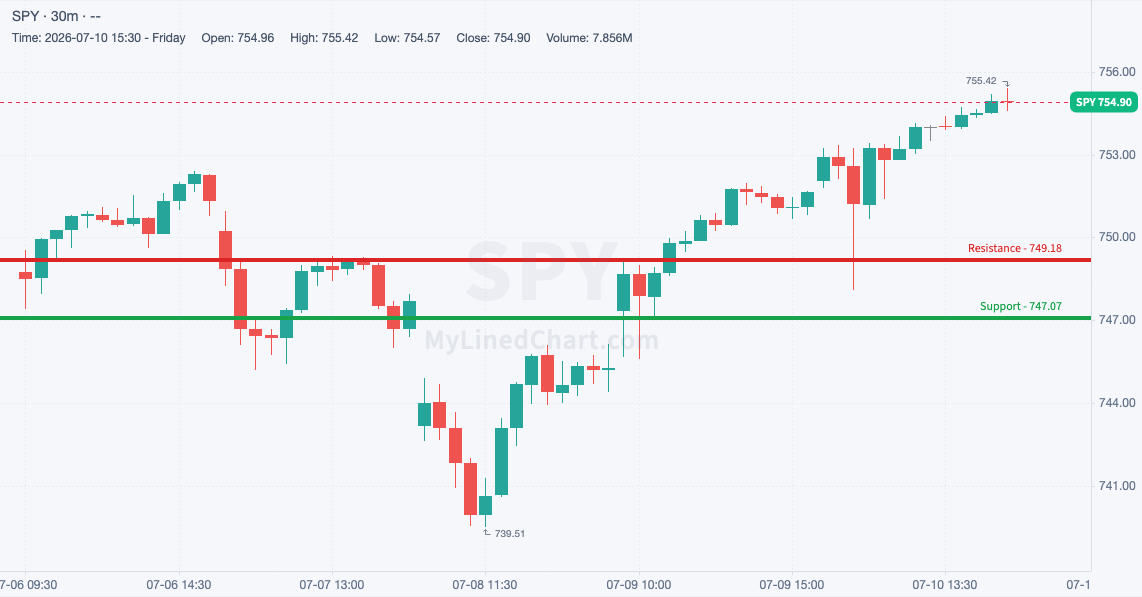
SPY (S&P 500 ETF) +0.65%
SPY lost 765.12 intraday on a dip to 763.24, but clawed it all back to finish at 771.30, mid-range for the week.
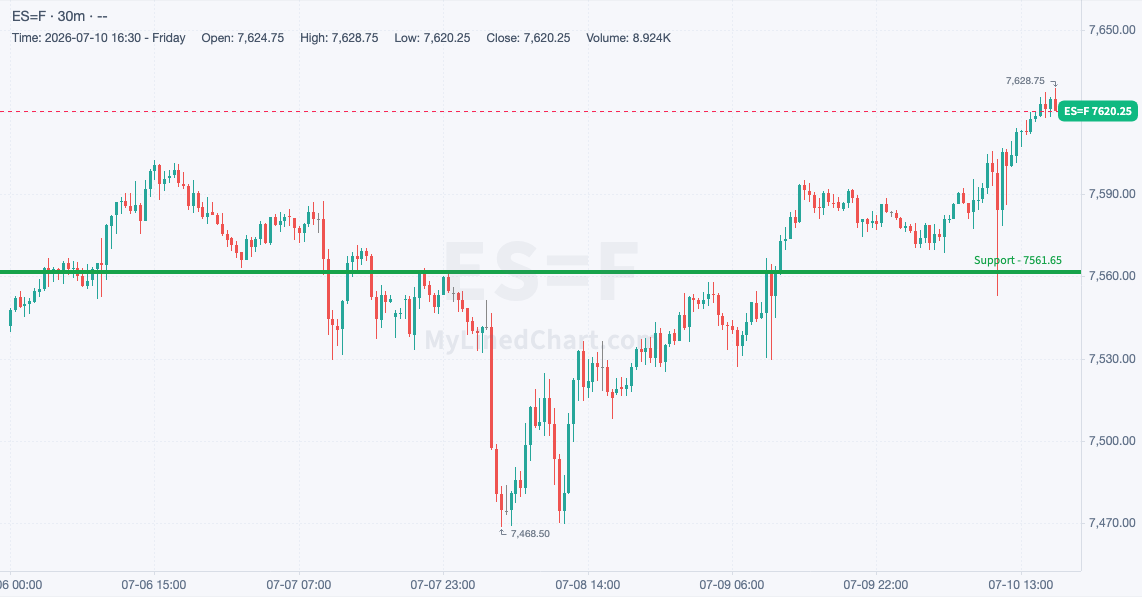
ES (E-mini S&P 500 futures) +0.57%
ES stayed above 7715 the whole way and finished at 7804.50, in the middle of its range.
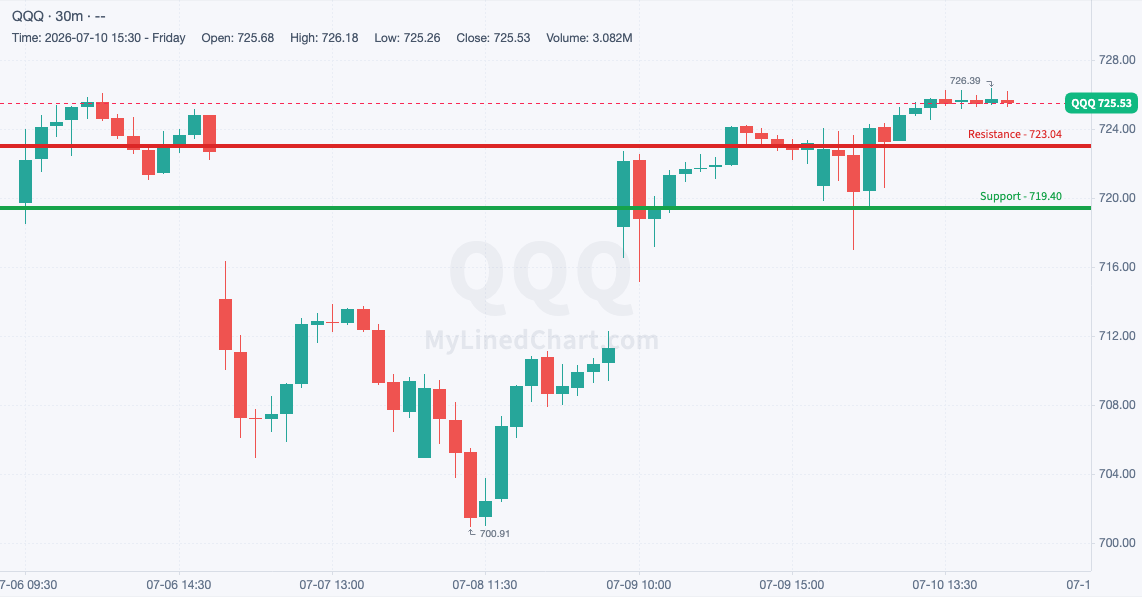
QQQ (Nasdaq 100 ETF) +2.28%
Support did its job for QQQ: 723.86 held cleanly and it closed at 744.45, at the top of its weekly range.
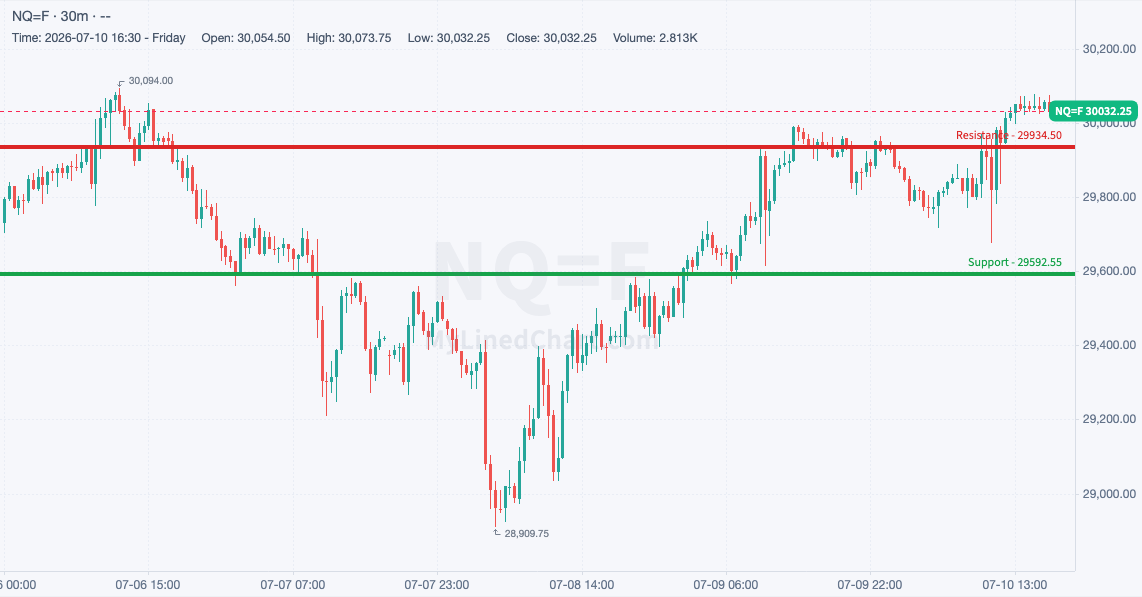
NQ (E-mini Nasdaq 100 futures) +2.28%
NQ never gave up the 29970.25 support: it held all week and closed at 30912.25, near the week's high.
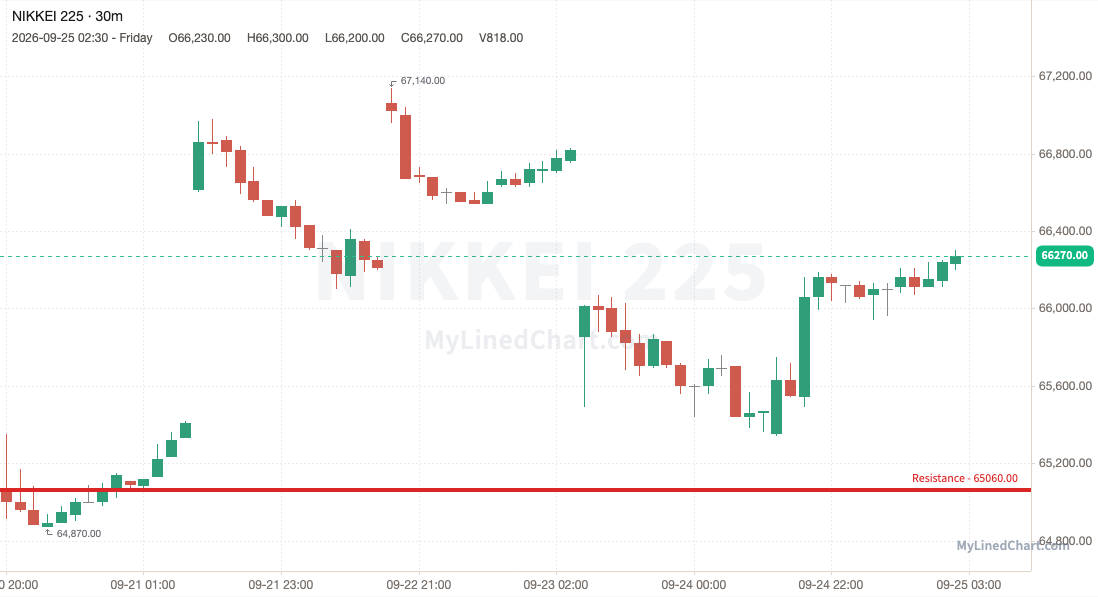
Nikkei 225 (Japan) +1.88%
Nikkei 225 opened the week under every level published and closed at 66270, in the middle of its range.
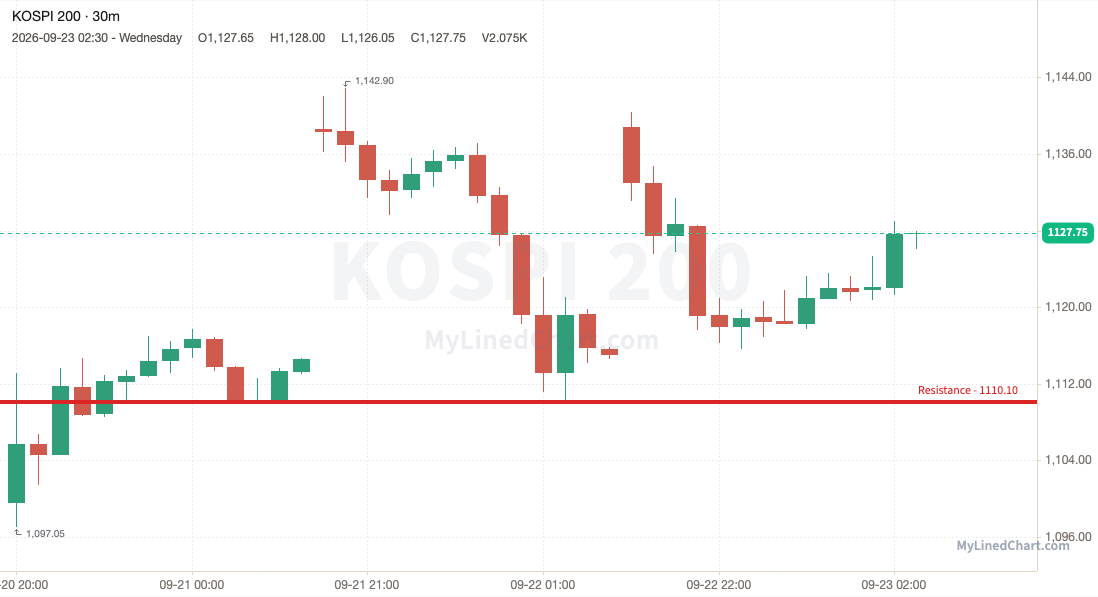
KOSPI 200 (Korea) +2.56%
KOSPI 200 opened the week under every level published and closed at 1127.75, around the middle of its weekly range.
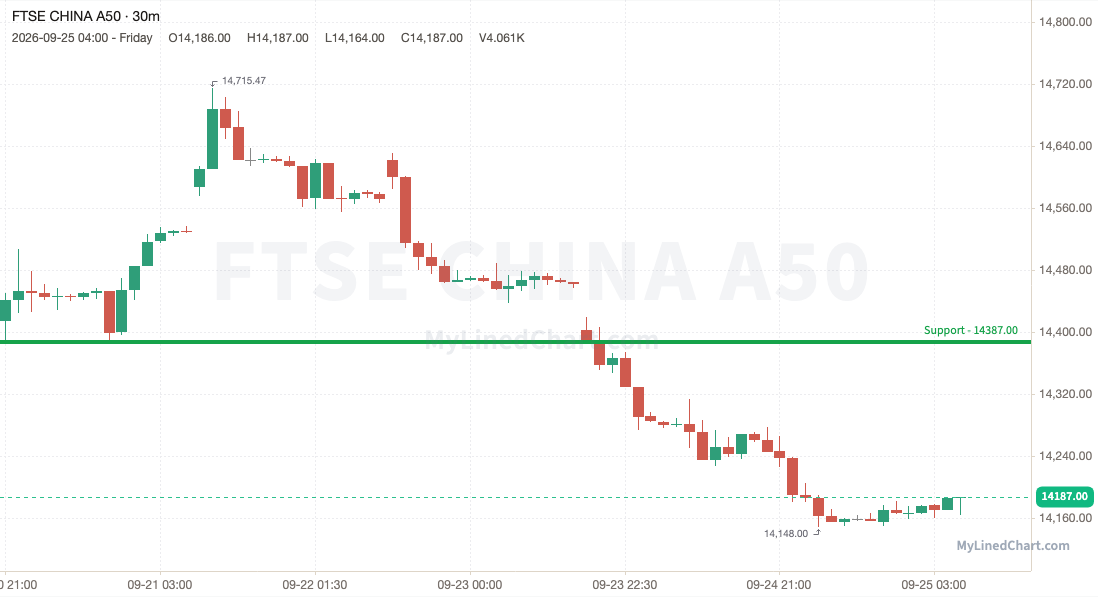
FTSE China A50 (China) -1.58%
FTSE China A50 broke the 14387 support and couldn't get back above it, closing at 14187, near the week's low.
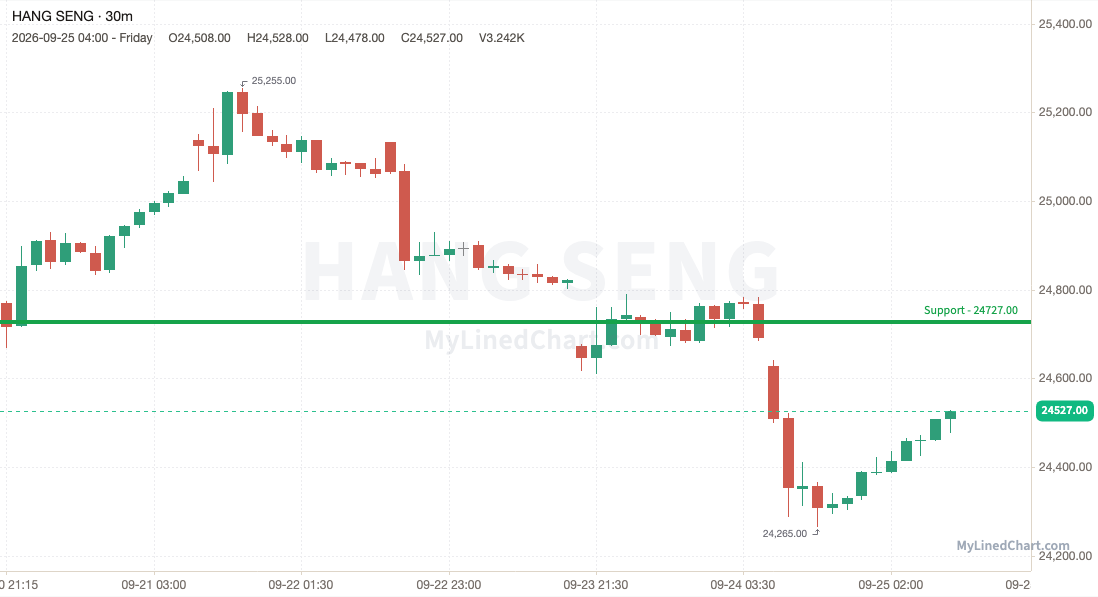
Hang Seng (Hong Kong) -0.99%
Hang Seng lost 24727 and stayed under it, ending the week at 24527, in the middle of its range.
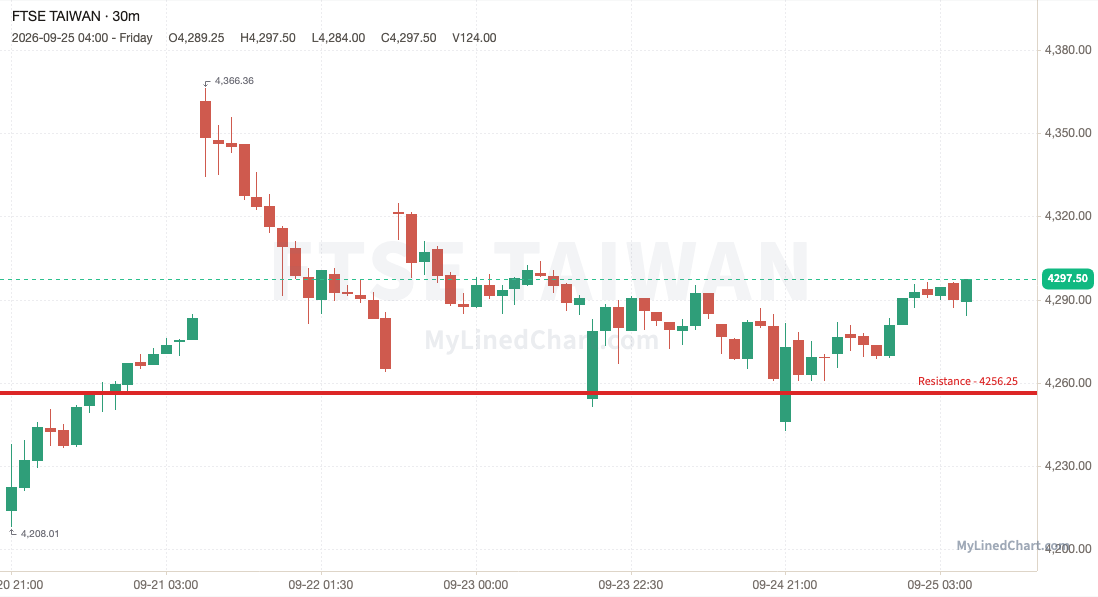
FTSE Taiwan (Taiwan) +1.99%
FTSE Taiwan opened the week under every level published and closed at 4297.50, around the middle of its weekly range.
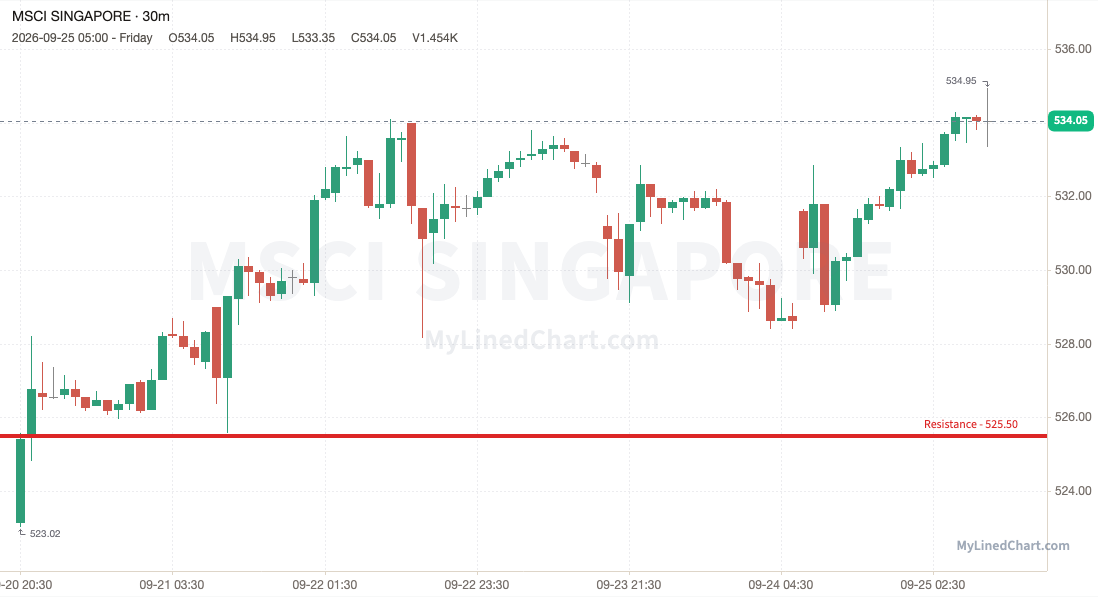
MSCI Singapore (Singapore) +2.09%
MSCI Singapore opened the week under every level published and closed at 534.05, near the week's high.
NIFTY 50 (India) -0.77%
NIFTY 50 lost 23440 and stayed under it, ending the week at 23261, in the middle of its range.

ASX 200 / SPI (Australia) -0.29%
The 8729 support gave way for SPI, which closed below it at 8715, at the bottom of its weekly range.

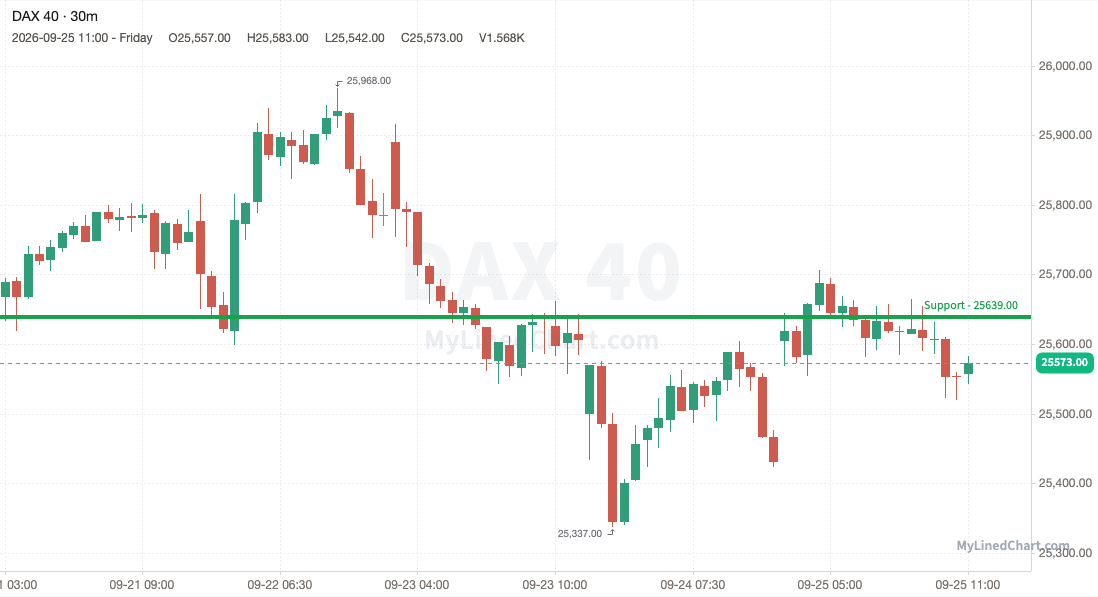
DAX 40 (Germany) -0.37%
DAX 40 broke the 25639 support and couldn't get back above it, closing at 25573, mid-range for the week.
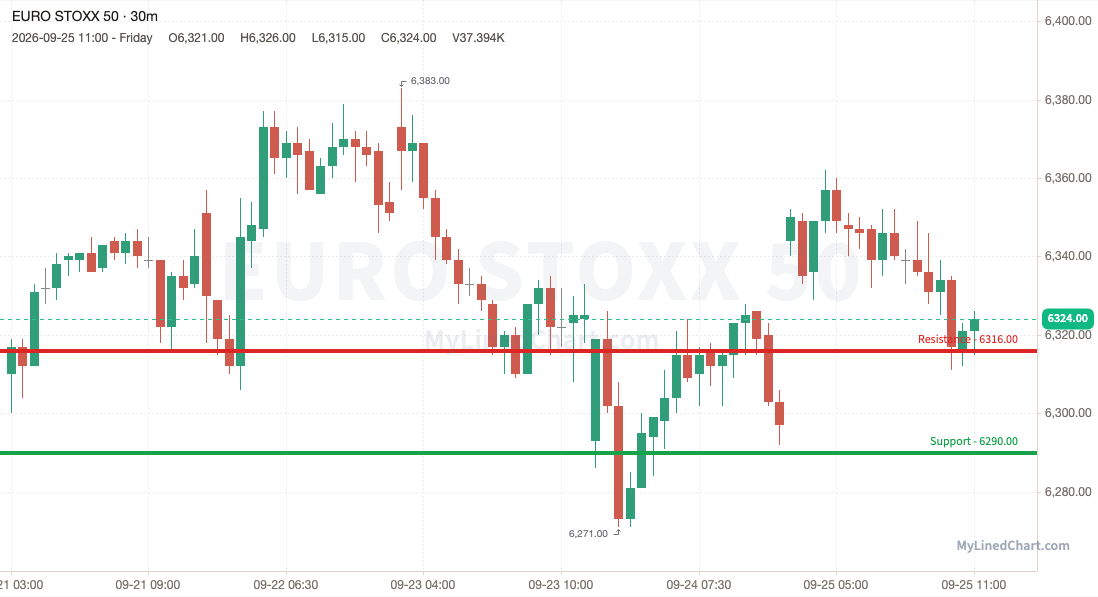
Euro Stoxx 50 (Eurozone) +0.22%
A midweek shakeout dragged Euro Stoxx 50 down to 6271 beneath 6290 before it recovered the line and settled at 6324, in the middle of its range.
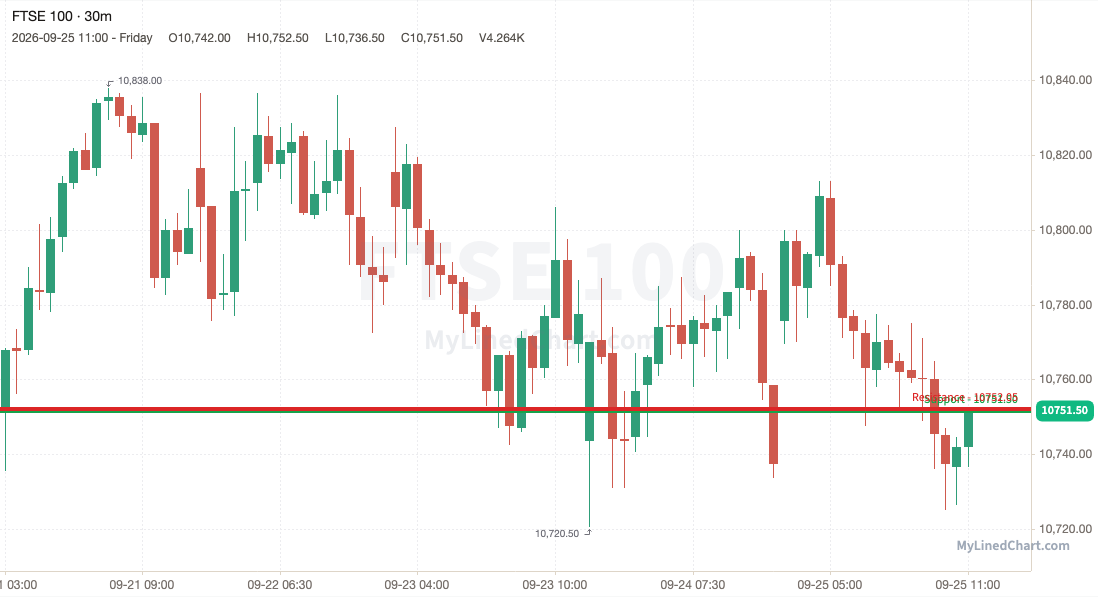
FTSE 100 (UK) +0.00%
FTSE 100 dipped under 10751.50 to 10720.50, then bought back up to close the week at 10751.50, around the middle of its weekly range.
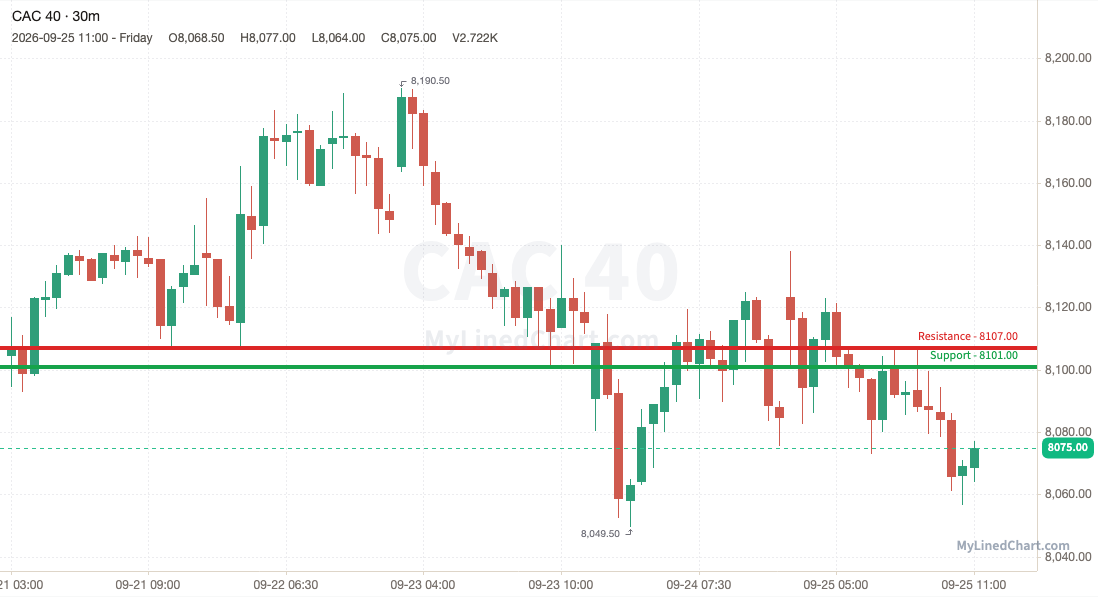
CAC 40 (France) -0.36%
CAC 40 broke the 8101 support and couldn't get back above it, closing at 8075, near the week's low.
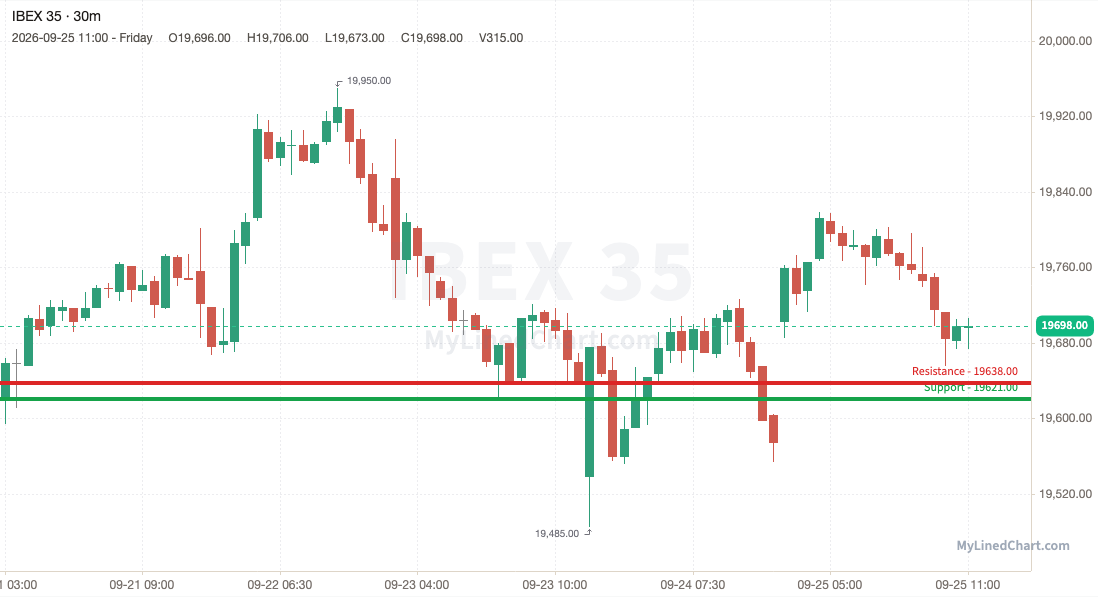
IBEX 35 (Spain) +0.39%
IBEX 35 lost 19621 intraday on a dip to 19485, but clawed it all back to finish at 19698, in the middle of its range.
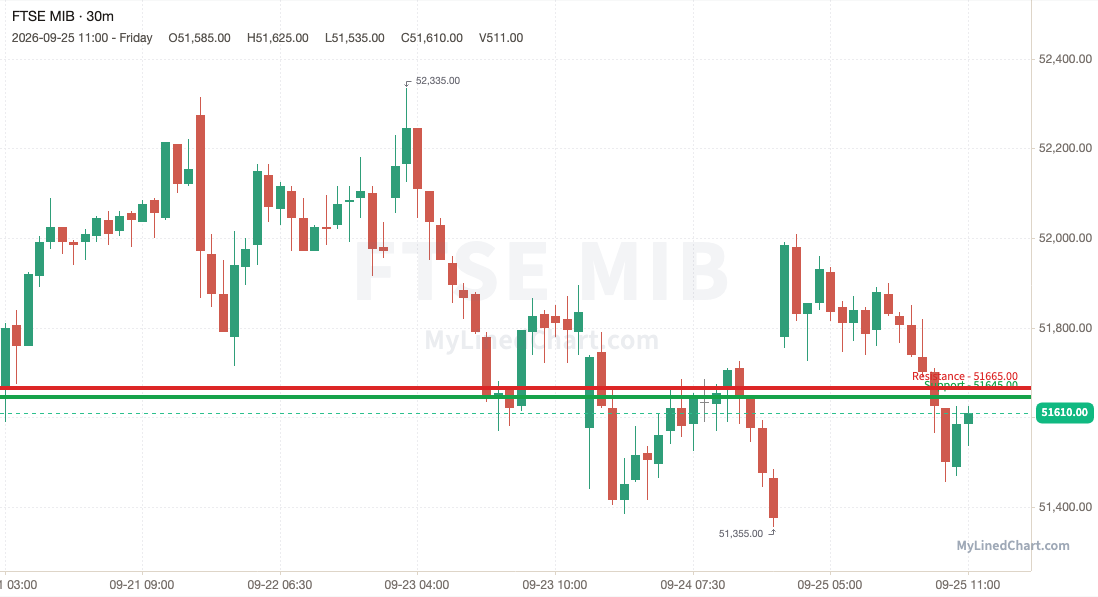
FTSE MIB (Italy) -0.10%
The 51645 support gave way for FTSE MIB, which closed below it at 51610, around the middle of its weekly range.
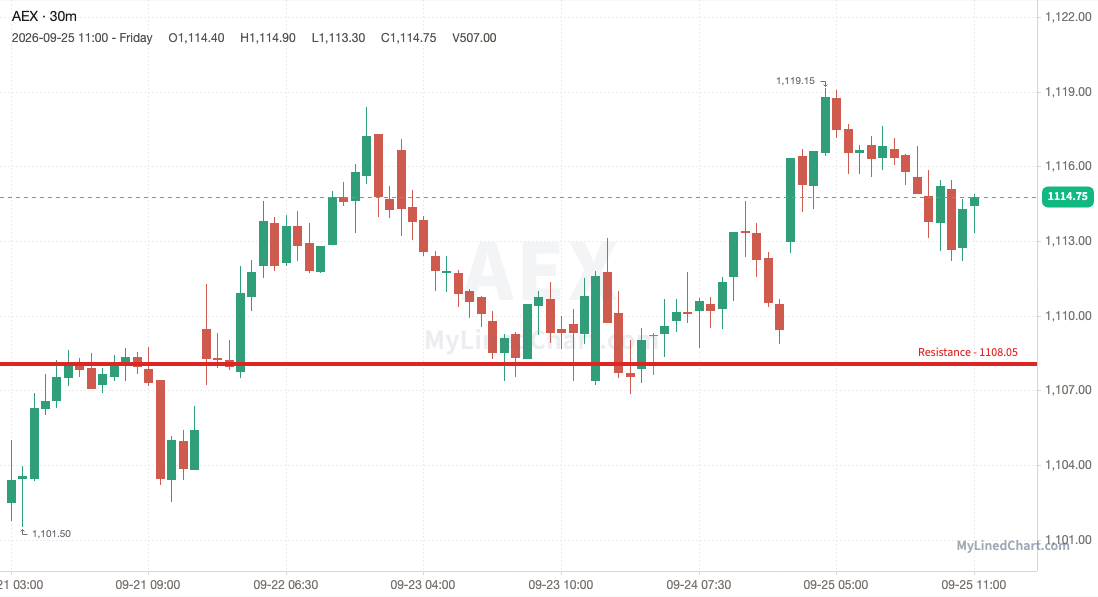
AEX (Netherlands) +1.12%
AEX opened the week under every level published and closed at 1114.75, mid-range for the week.
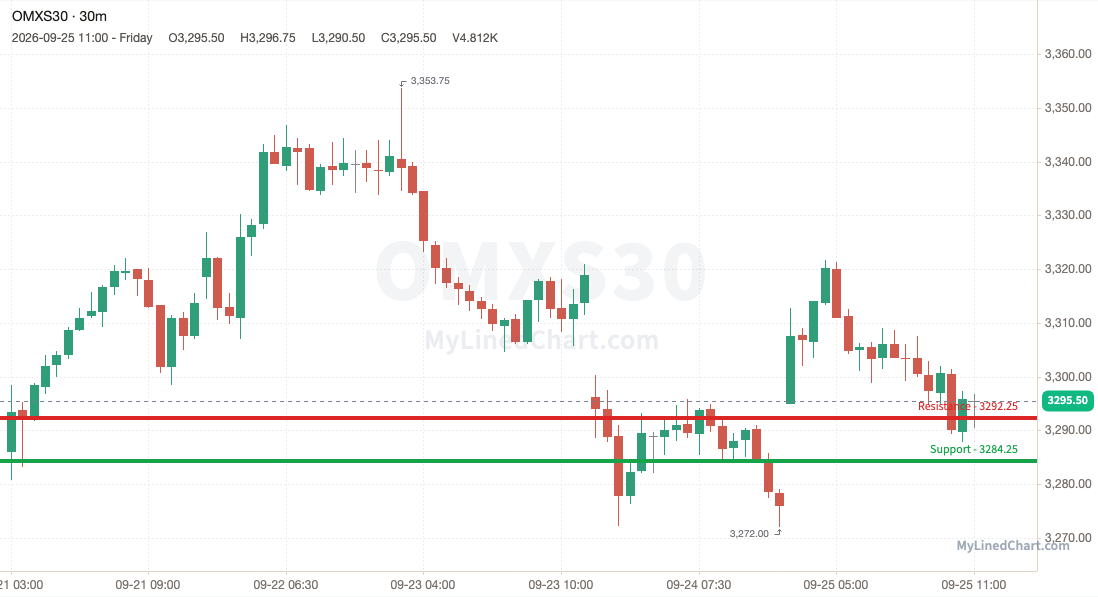
OMXS30 (Sweden) +0.29%
Buyers had to work for it: OMXS30 flushed to 3272, below the 3284.25 support, then reclaimed the level and closed at 3295.50, in the middle of its range.
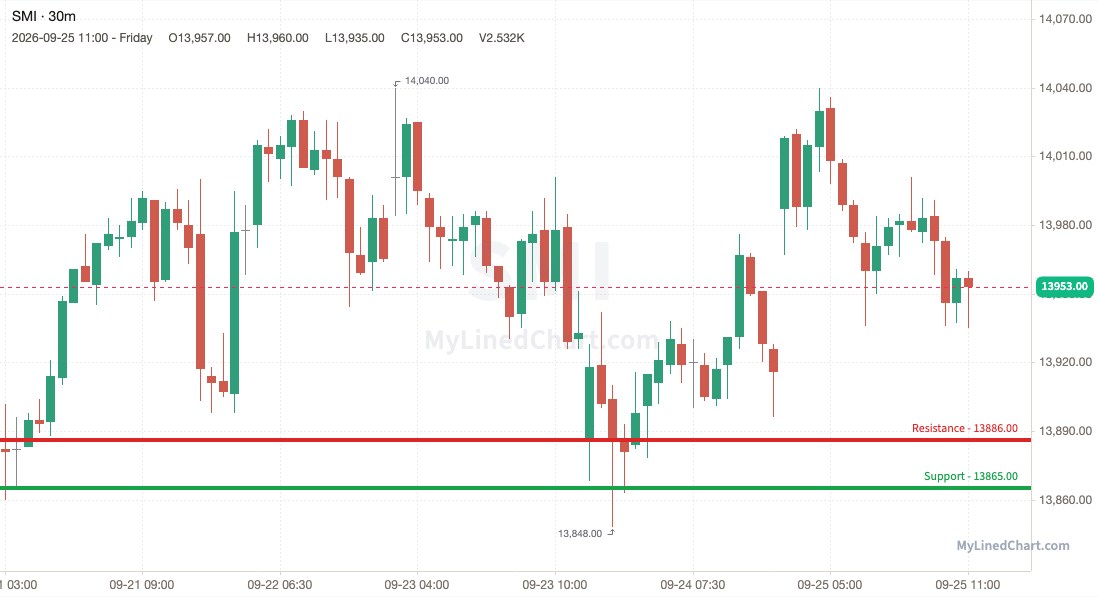
SMI (Switzerland) +0.51%
SMI lost 13865 intraday on a dip to 13848, but clawed it all back to finish at 13953, around the middle of its weekly range.
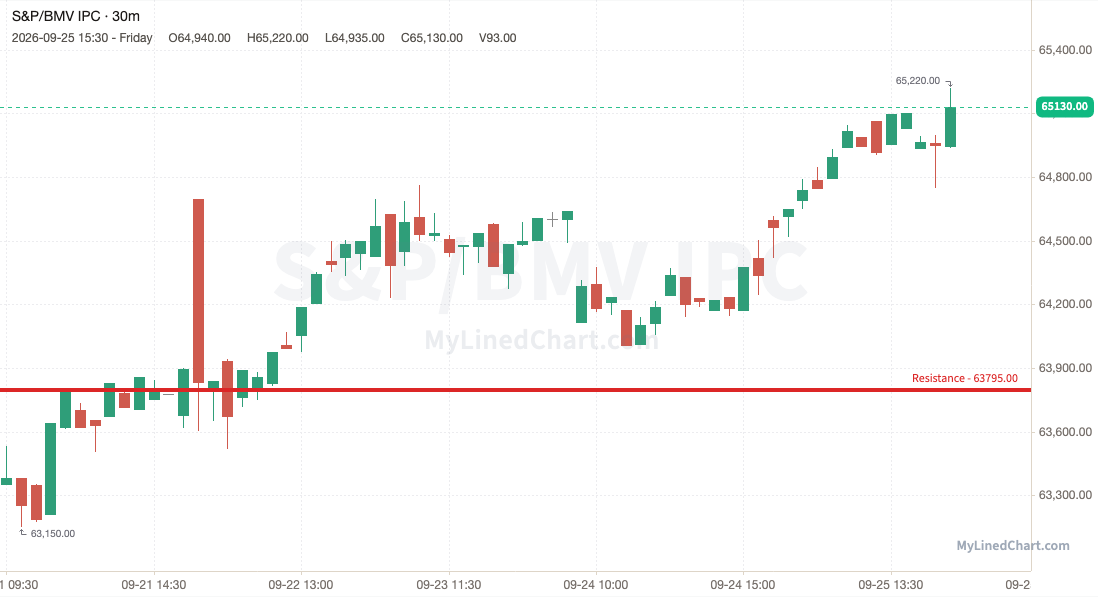
S&P/BMV IPC (Mexico) +2.81%
S&P/BMV IPC opened the week under every level published and closed at 65130, near the week's high.
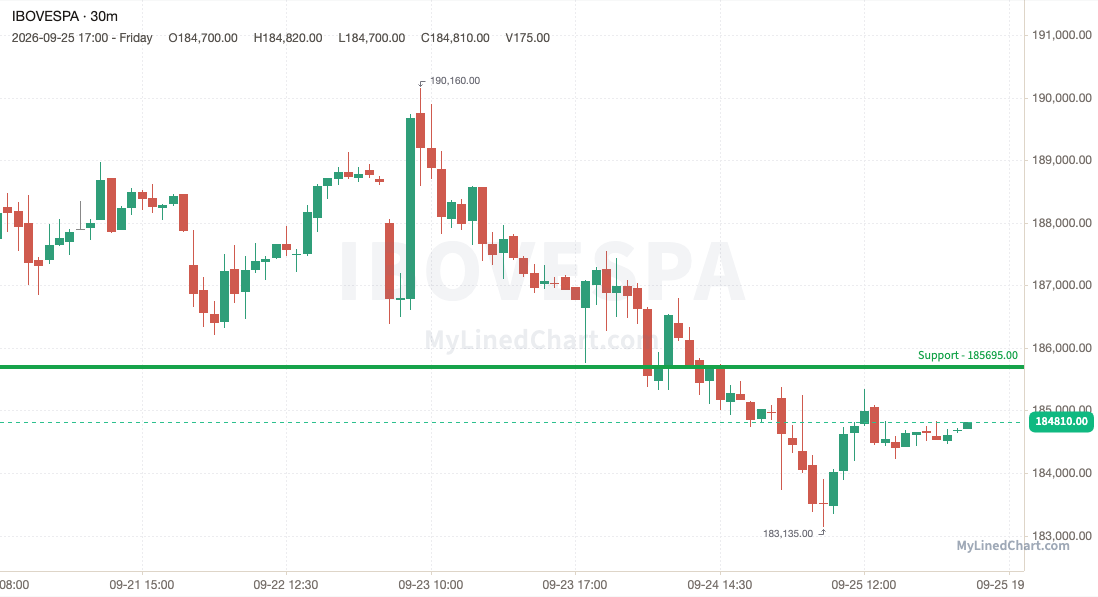
Ibovespa (Brazil) -1.56%
Ibovespa lost 185695 and stayed under it, ending the week at 184810, in the middle of its range.
See the latest daily SPY, ES, QQQ & NQ levels, posted the evening before the next day's session.
MyLinedChart turns your technical analysis into trading rules. Draw your levels, export your entire chart to XLSX, and turn your rules into trades. Or, have Claude, Codex, or Cursor do the work for you.
Not financial advice. Objective market structure and levels only. You make and own your trades.