
SPY, DAX +18 Global Market Levels: Oct 5-9 Week in Review and Chart Pack
Published · Lee H.
A mixed week across the US, Asia, Europe and Latin America: 11 of 23 finished higher, with the week's low on Thursday, October 8.
How each one played out
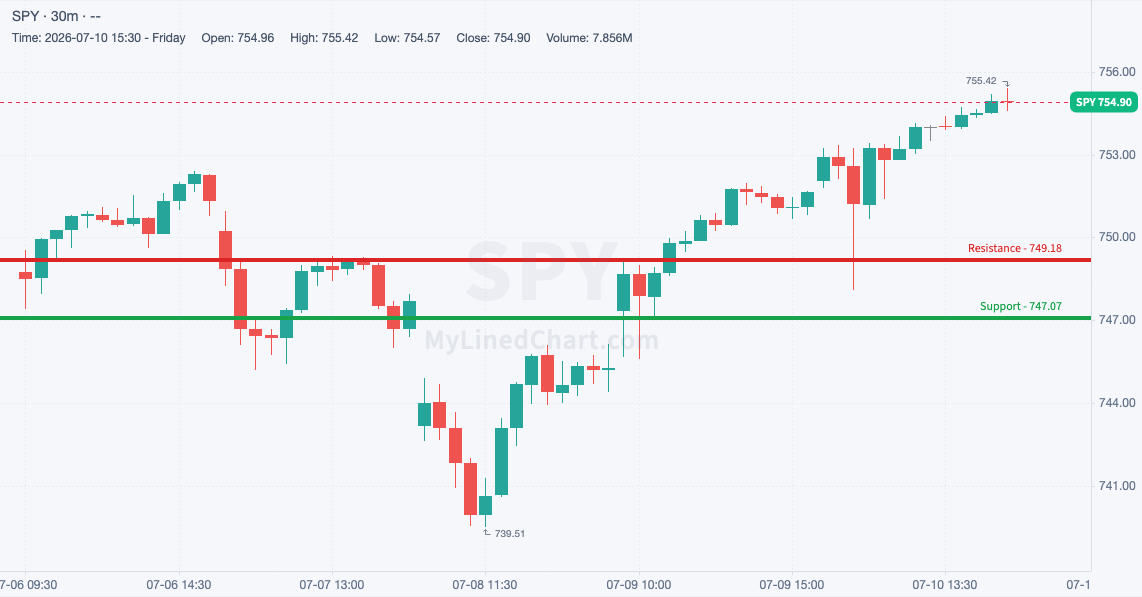
SPY (S&P 500 ETF) +1.15%
Support did its job for SPY: 768.96 held cleanly and it closed at 778.53, around the middle of its weekly range.
Busiest levels this week:
SPY 777.78: most volume, 4221026 shares, touched 12 times
SPY 774.75: 2nd most, 3877401 shares, touched 11 times
SPY 779.99: 3rd most, 3478993 shares, touched 12 times
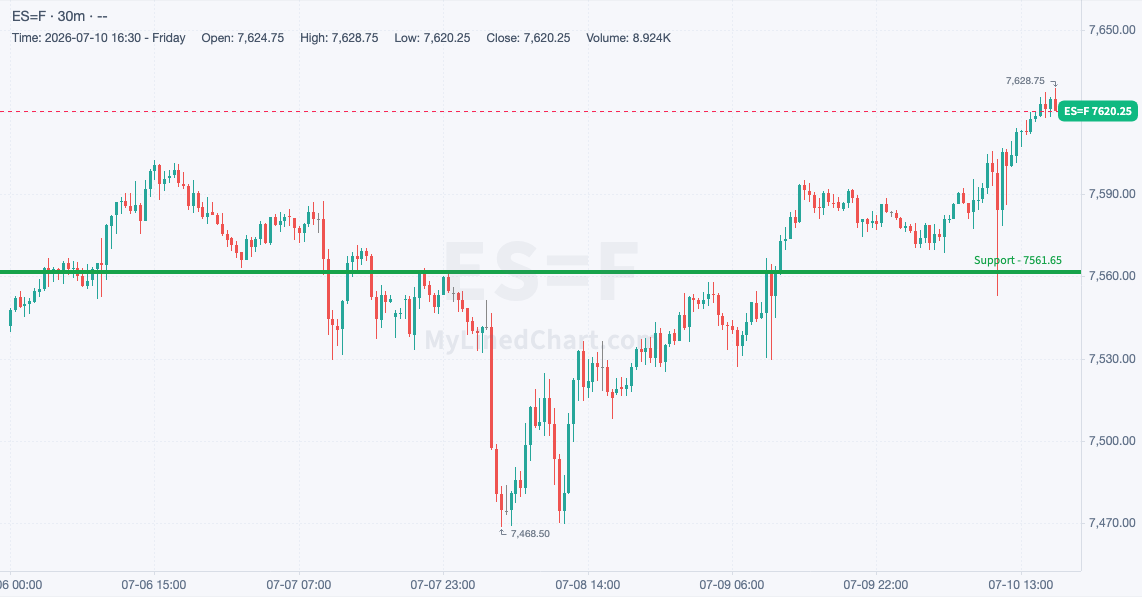
ES (E-mini S&P 500 futures) +1.11%
ES never gave up the 7778.25 support: it held all week and closed at 7865, mid-range for the week.
Busiest levels this week:
ES 7853.25: most volume, 47881 contracts, touched 3 times
ES 7878.25: 2nd most, 47689 contracts, touched 11 times
ES 7882.50: 3rd most, 41036 contracts, touched 8 times
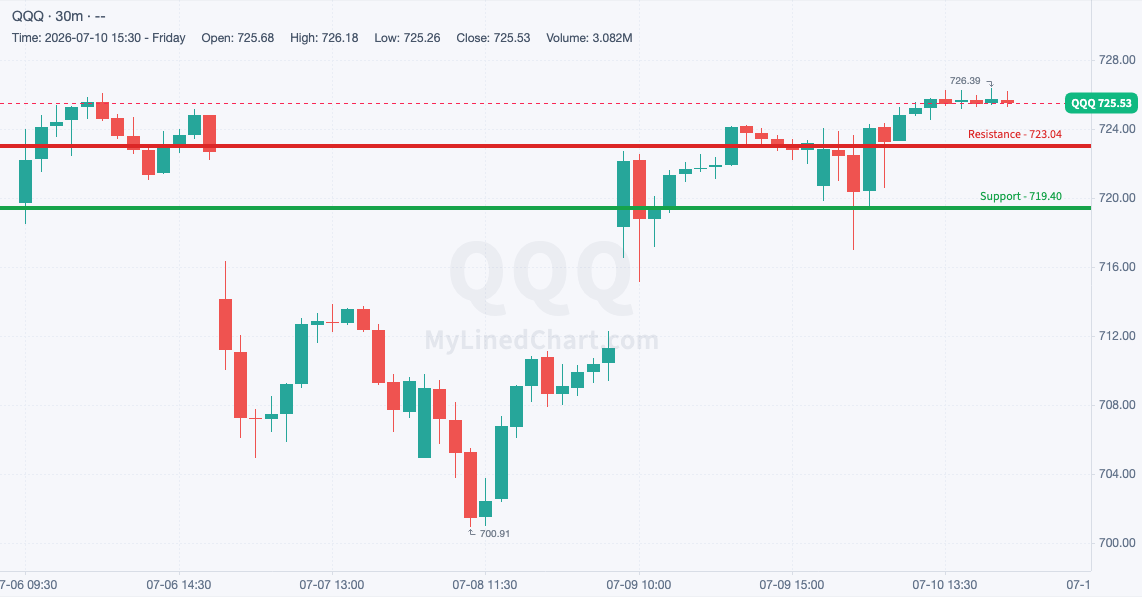
QQQ (Nasdaq 100 ETF) +0.25%
QQQ dipped under 748.80 to 743.23, then bought back up to close the week at 751.24, in the middle of its range.
Busiest levels this week:
QQQ 746.38: most volume, 4790595 shares, touched 23 times
QQQ 760.51: 2nd most, 3478854 shares, touched 11 times
QQQ 756.54: 3rd most, 3166642 shares, touched 15 times
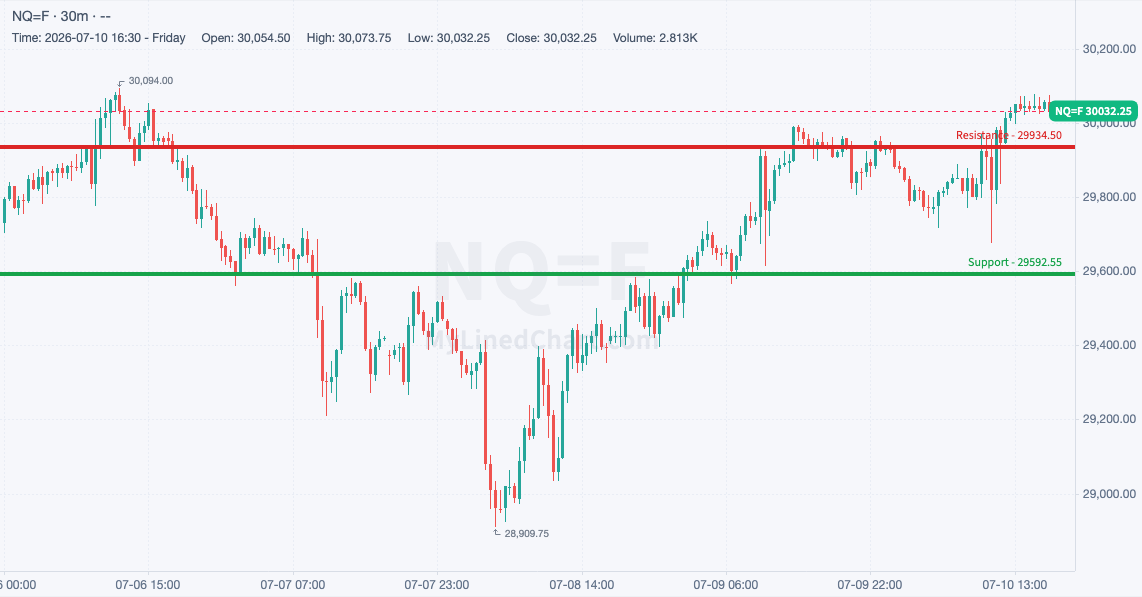
NQ (E-mini Nasdaq 100 futures) +0.23%
Buyers had to work for it: NQ flushed to 30792, below the 31050 support, then reclaimed the level and closed at 31127.75, around the middle of its weekly range.
Busiest levels this week:
NQ 31356.25: most volume, 18706 contracts, touched 3 times
NQ 31339: 2nd most, 17992 contracts, touched 6 times
NQ 31360: 3rd most, 17292 contracts, touched 5 times
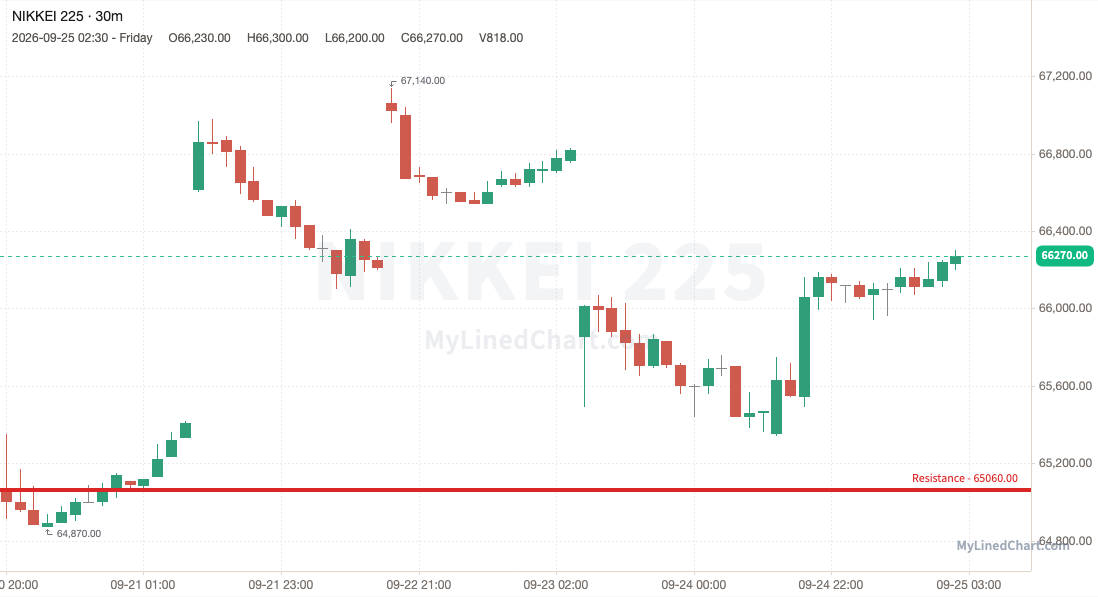
Nikkei 225 (Japan) -0.60%
Nikkei 225 broke the 69780 support and couldn't get back above it, closing at 69370, mid-range for the week.
Busiest levels this week:
Nikkei 225 70110: most volume, 4210 contracts, touched 12 times
Nikkei 225 70290: 2nd most, 4003 contracts, touched 18 times
Nikkei 225 68420: 3rd most, 3191 contracts, touched 13 times
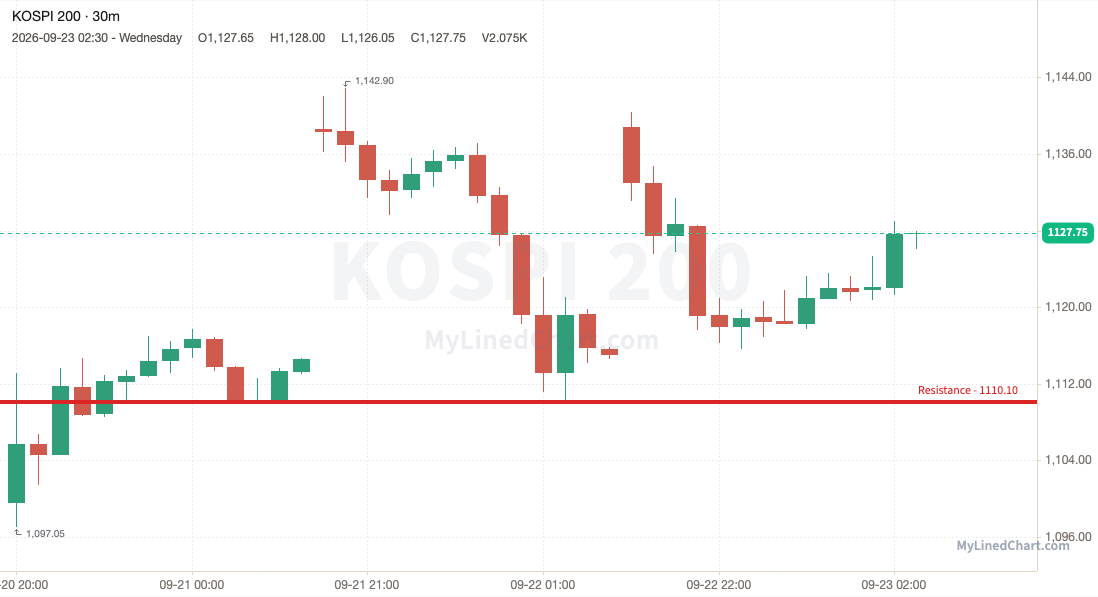
KOSPI 200 (Korea) -6.58%
KOSPI 200 lost 1104.85 and stayed under it, ending the week at 1048.40, down at the lows.
Busiest levels this week:
KOSPI 200 1049.85: most volume, 11499 contracts, touched 18 times
KOSPI 200 1048.25: 2nd most, 9675 contracts, touched 16 times
KOSPI 200 1082.05: 3rd most, 9124 contracts, touched 4 times
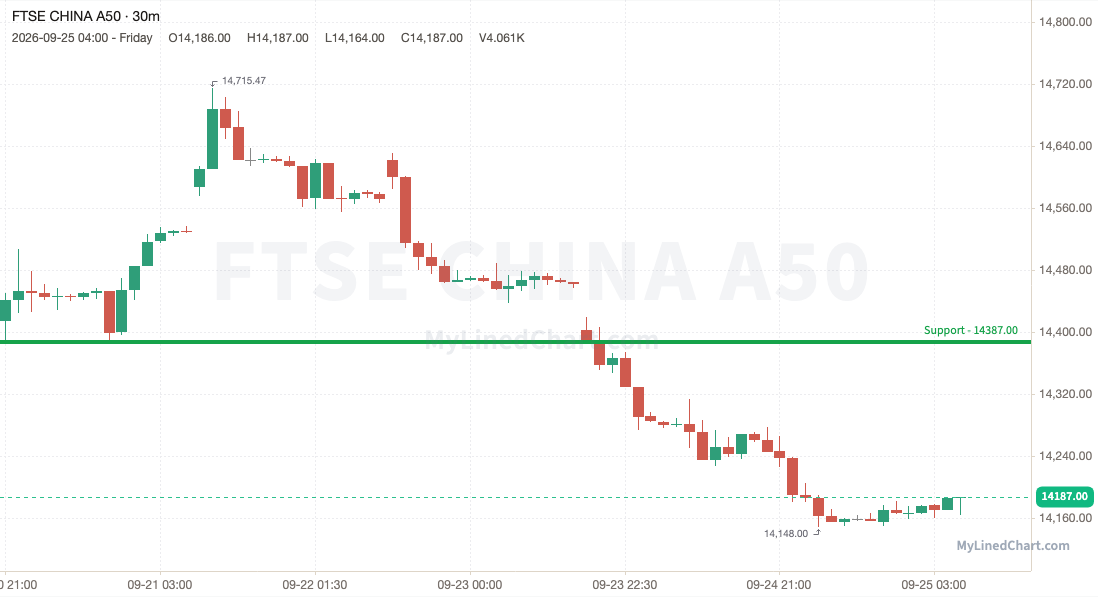
FTSE China A50 (China) -0.56%
The 13832 support gave way for FTSE China A50, which closed below it at 13764, around the middle of its weekly range.
Busiest levels this week:
FTSE China A50 13679: most volume, 39327 contracts, touched 20 times
FTSE China A50 13830: 2nd most, 29541 contracts, touched 32 times
FTSE China A50 13811: 3rd most, 21768 contracts, touched 21 times
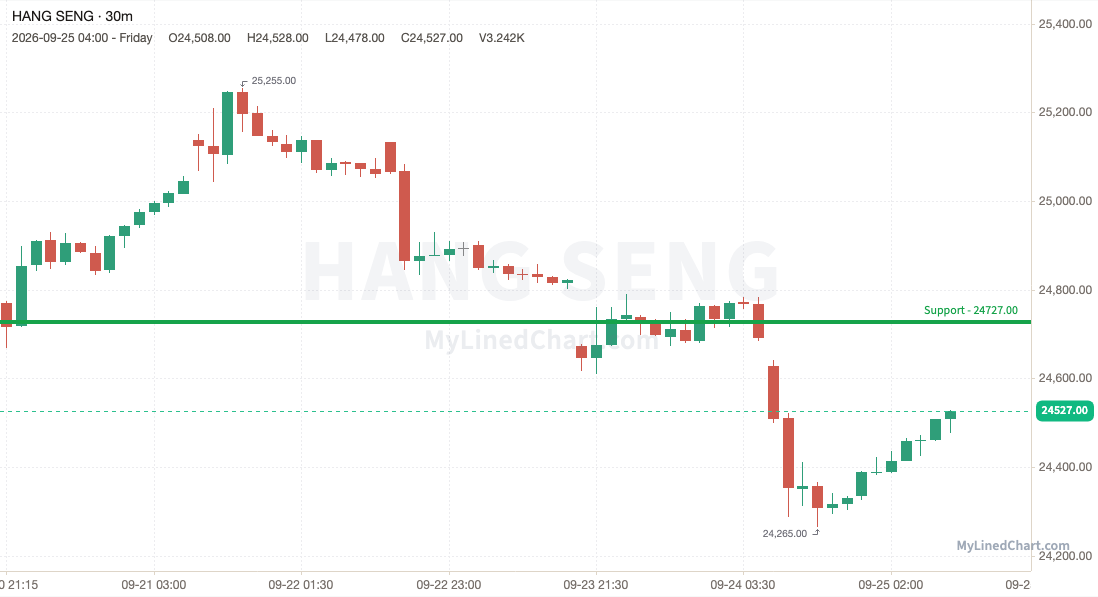
Hang Seng (Hong Kong) +1.38%
Buyers had to work for it: Hang Seng flushed to 23692, below the 23844 support, then reclaimed the level and closed at 24194, mid-range for the week.
Busiest levels this week:
Hang Seng 24083: most volume, 16400 contracts, touched 32 times
Hang Seng 24046: 2nd most, 11847 contracts, touched 20 times
Hang Seng 23997: 3rd most, 11080 contracts, touched 19 times
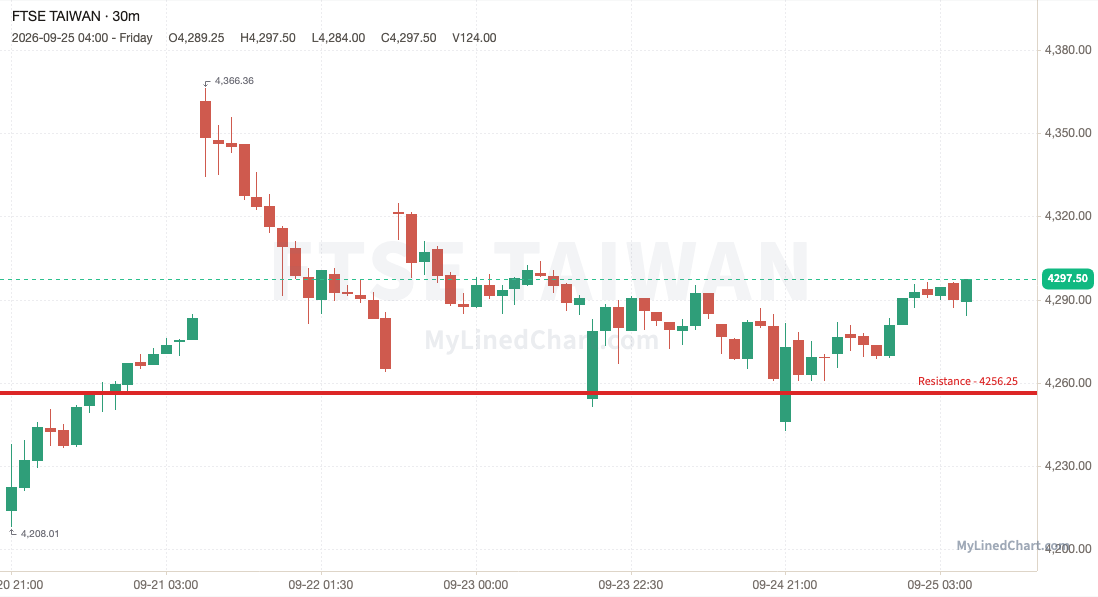
FTSE Taiwan (Taiwan) -1.69%
FTSE Taiwan lost 4384.50 and stayed under it, ending the week at 4314.75, in the middle of its range.
Busiest levels this week:
FTSE Taiwan 4426.50: most volume, 2873 contracts, touched 14 times
FTSE Taiwan 4417.50: 2nd most, 2764 contracts, touched 11 times
FTSE Taiwan 4417.25: 3rd most, 1984 contracts, touched 7 times
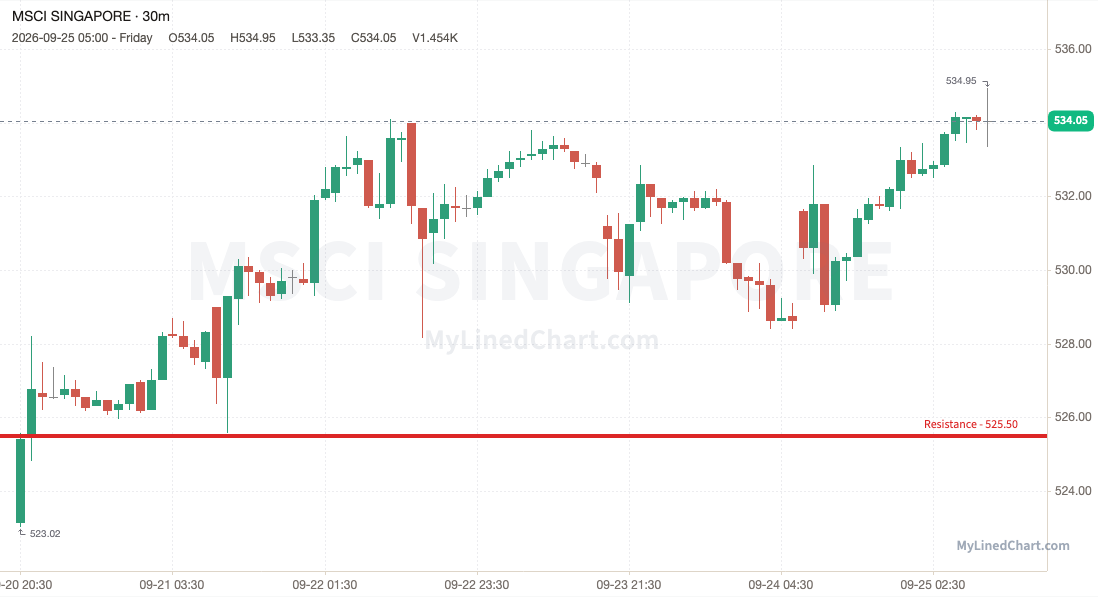
MSCI Singapore (Singapore) -4.56%
The 524.35 support gave way for MSCI Singapore, which closed below it at 502.45, at the bottom of its weekly range.
Busiest levels this week:
MSCI Singapore 501.30: most volume, 4675 contracts, touched 19 times
MSCI Singapore 501.45: 2nd most, 3529 contracts, touched 7 times
MSCI Singapore 529.70: 3rd most, 3245 contracts, touched 19 times
NIFTY 50 (India) +0.02%
NIFTY 50 dipped under 22622.90 to 22269.40, then bought back up to close the week at 22628.80, mid-range for the week.
Busiest levels this week:
NIFTY 50 22622.90: most volume, 10575 contracts, touched 3 times
NIFTY 50 22652.60: 2nd most, 9637 contracts, touched 4 times
NIFTY 50 22623.90: 3rd most, 9601 contracts, touched 5 times

ASX 200 / SPI (Australia) -0.03%
Buyers had to work for it: SPI flushed to 8681, below the 8734 support, then reclaimed the level and closed at 8747, in the middle of its range.
Busiest levels this week:
SPI 8716: most volume, 27741 contracts, touched 180 times
SPI 8802: 2nd most, 14780 contracts, touched 165 times
SPI 8767: 3rd most, 10700 contracts, touched 45 times

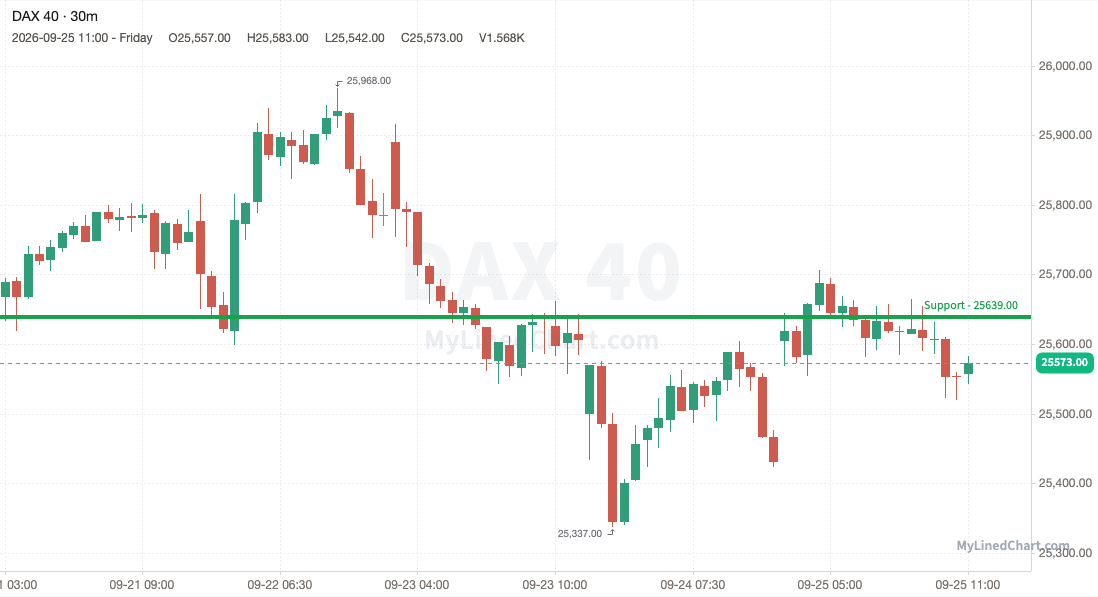
DAX 40 (Germany) -0.88%
The 25459 support gave way for DAX 40, which closed below it at 25243, around the middle of its weekly range.
Busiest levels this week:
DAX 40 25376: most volume, 2193 contracts, touched 19 times
DAX 40 25356: 2nd most, 2169 contracts, touched 19 times
DAX 40 25209: 3rd most, 1727 contracts, touched 7 times
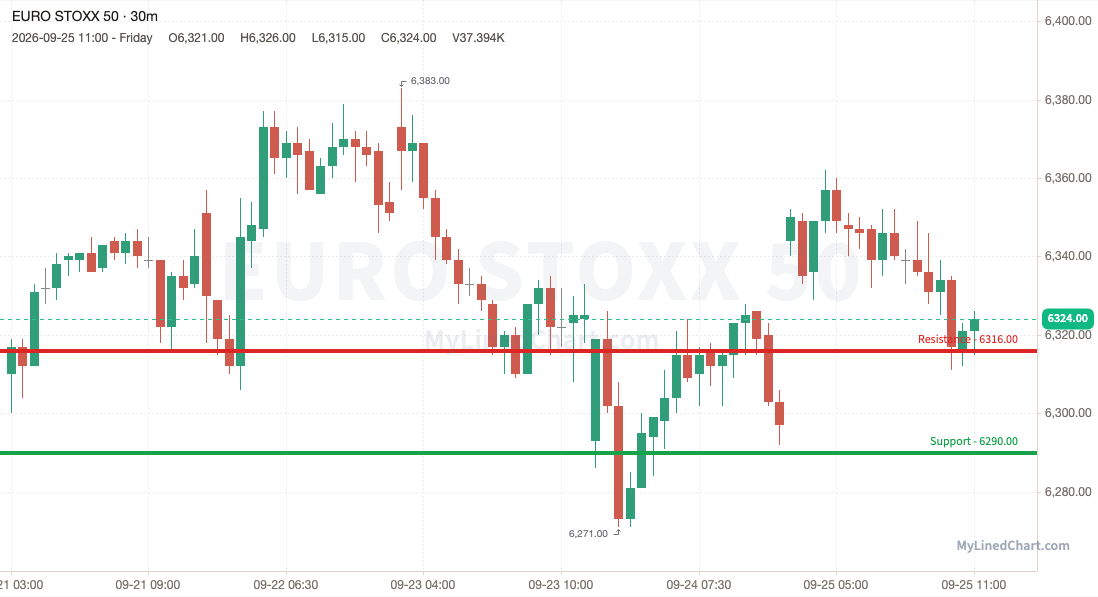
Euro Stoxx 50 (Eurozone) -0.99%
Euro Stoxx 50 broke the 6254 support and couldn't get back above it, closing at 6194, mid-range for the week.
Busiest levels this week:
Euro Stoxx 50 6254: most volume, 178341 contracts, touched 37 times
Euro Stoxx 50 6266: 2nd most, 162898 contracts, touched 32 times
Euro Stoxx 50 6249: 3rd most, 149972 contracts, touched 37 times
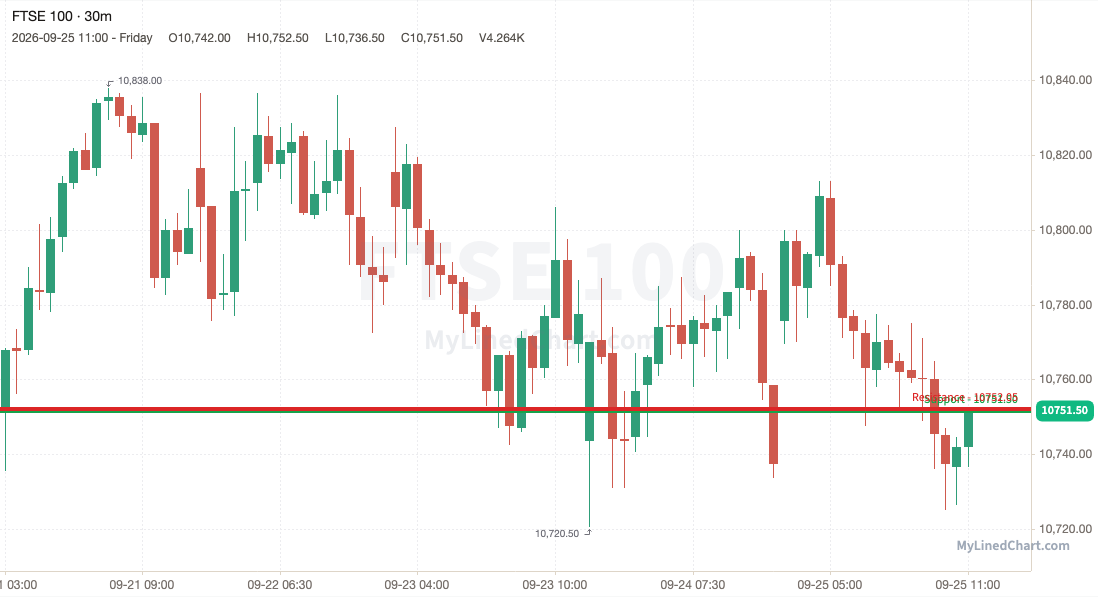
FTSE 100 (UK) +0.35%
FTSE 100 dipped under 10561.50 to 10407.50, then bought back up to close the week at 10604, in the middle of its range.
Busiest levels this week:
FTSE 100 10502.26: most volume, 347 contracts, touched 8 times
FTSE 100 10501.95: 2nd most, 340 contracts, touched 5 times
FTSE 100 10501.75: 3rd most, 336 contracts, touched 10 times
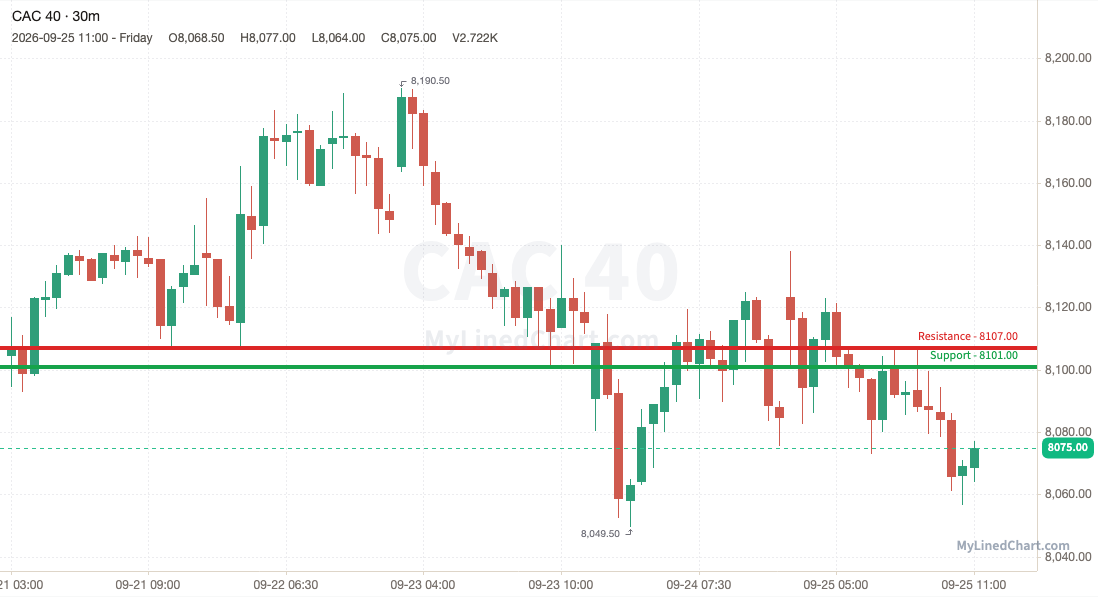
CAC 40 (France) -0.75%
The 7858 support gave way for CAC 40, which closed below it at 7803, around the middle of its weekly range.
Busiest levels this week:
CAC 40 7858: most volume, 5304 contracts, touched 19 times
CAC 40 7876: 2nd most, 4845 contracts, touched 20 times
CAC 40 7849: 3rd most, 4776 contracts, touched 17 times
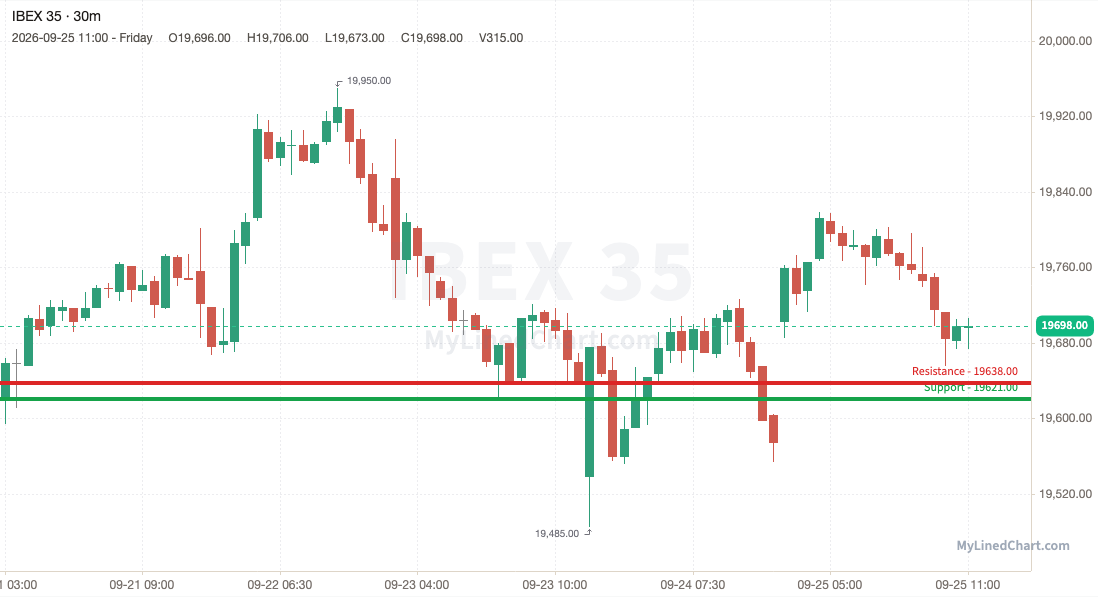
IBEX 35 (Spain) -0.29%
IBEX 35 broke the 19110 support and couldn't get back above it, closing at 19068, mid-range for the week.
Busiest levels this week:
IBEX 35 19088: most volume, 655 contracts, touched 13 times
IBEX 35 18474: 2nd most, 628 contracts, touched 21 times
IBEX 35 19087: 3rd most, 595 contracts, touched 15 times
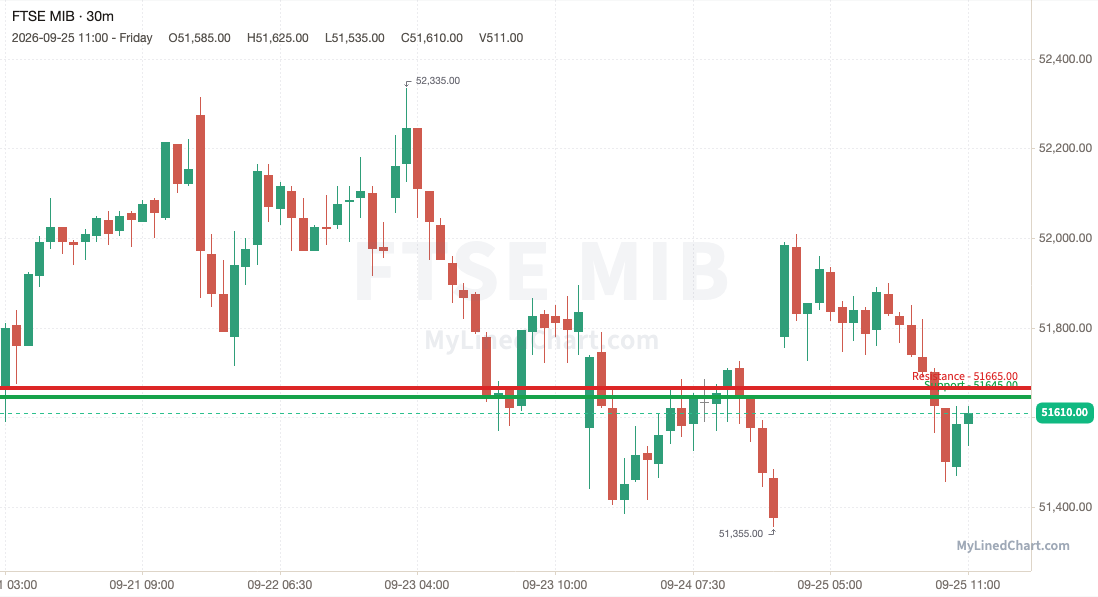
FTSE MIB (Italy) -1.59%
FTSE MIB lost 50225 and stayed under it, ending the week at 49500, in the middle of its range.
Busiest levels this week:
FTSE MIB 50510: most volume, 2708 contracts, touched 25 times
FTSE MIB 49155: 2nd most, 2179 contracts, touched 26 times
FTSE MIB 50225: 3rd most, 1712 contracts, touched 18 times
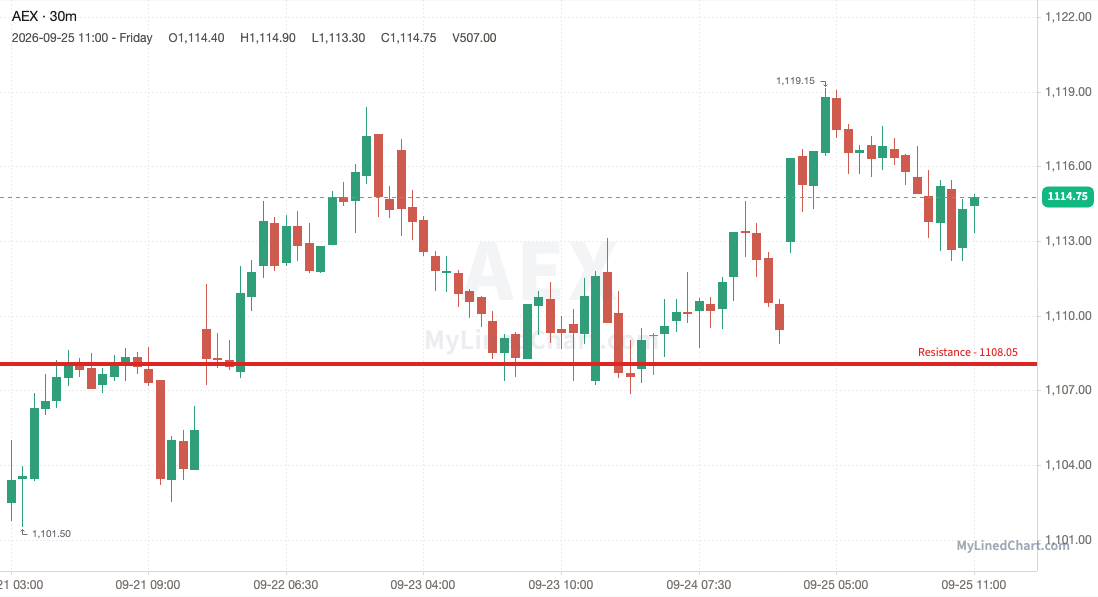
AEX (Netherlands) +1.00%
AEX dipped under 1120.95 to 1108.20, then bought back up to close the week at 1132.20, at the top of its weekly range.
Busiest levels this week:
AEX 1124.65: most volume, 1116 contracts, touched 22 times
AEX 1120.95: 2nd most, 1028 contracts, touched 21 times
AEX 1125.50: 3rd most, 867 contracts, touched 15 times
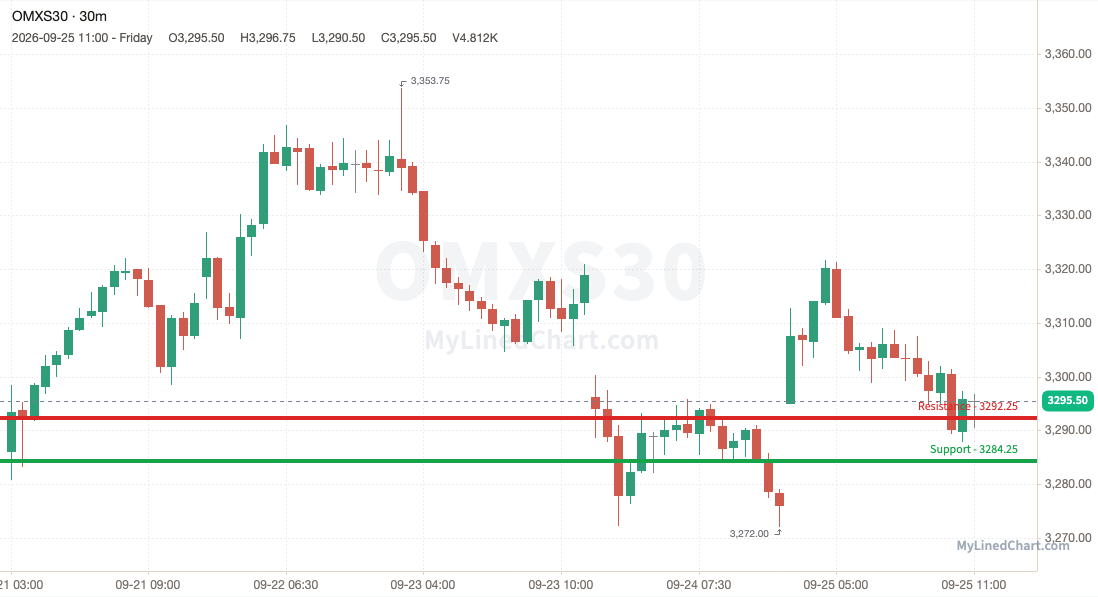
OMXS30 (Sweden) +0.11%
Buyers had to work for it: OMXS30 flushed to 3190.50, below the 3259.25 support, then reclaimed the level and closed at 3263, mid-range for the week.
Busiest levels this week:
OMXS30 3282.50: most volume, 23050 contracts, touched 47 times
OMXS30 3237.25: 2nd most, 13883 contracts, touched 18 times
OMXS30 3250.75: 3rd most, 12040 contracts, touched 26 times
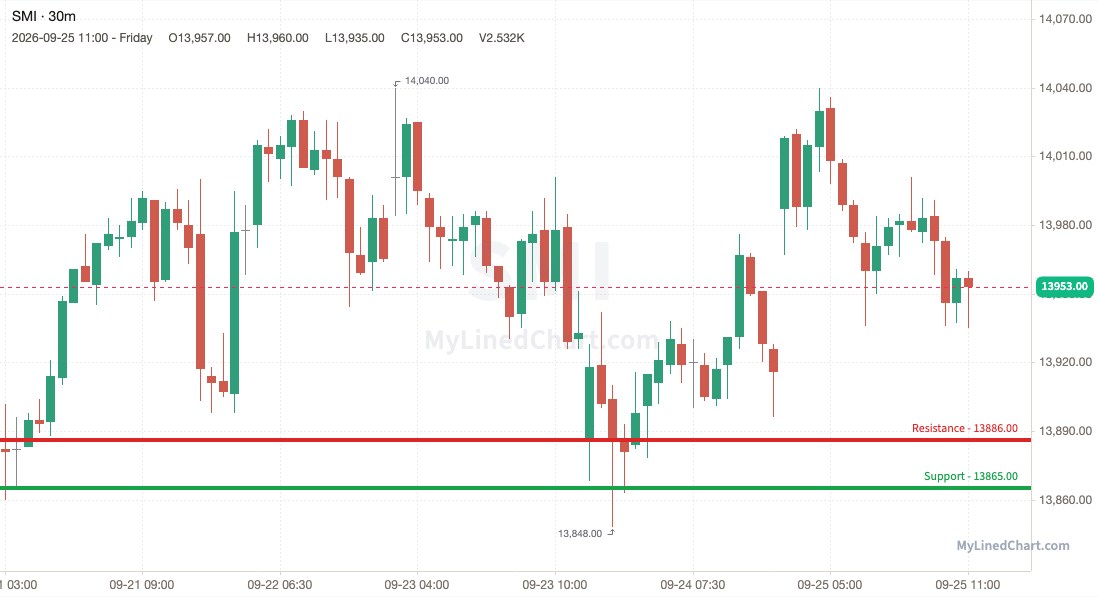
SMI (Switzerland) +0.61%
SMI lost 13711 intraday on a dip to 13623, but clawed it all back to finish at 13797, in the middle of its range.
Busiest levels this week:
SMI 13799: most volume, 5431 contracts, touched 30 times
SMI 13801: 2nd most, 4404 contracts, touched 17 times
SMI 13711: 3rd most, 4268 contracts, touched 30 times
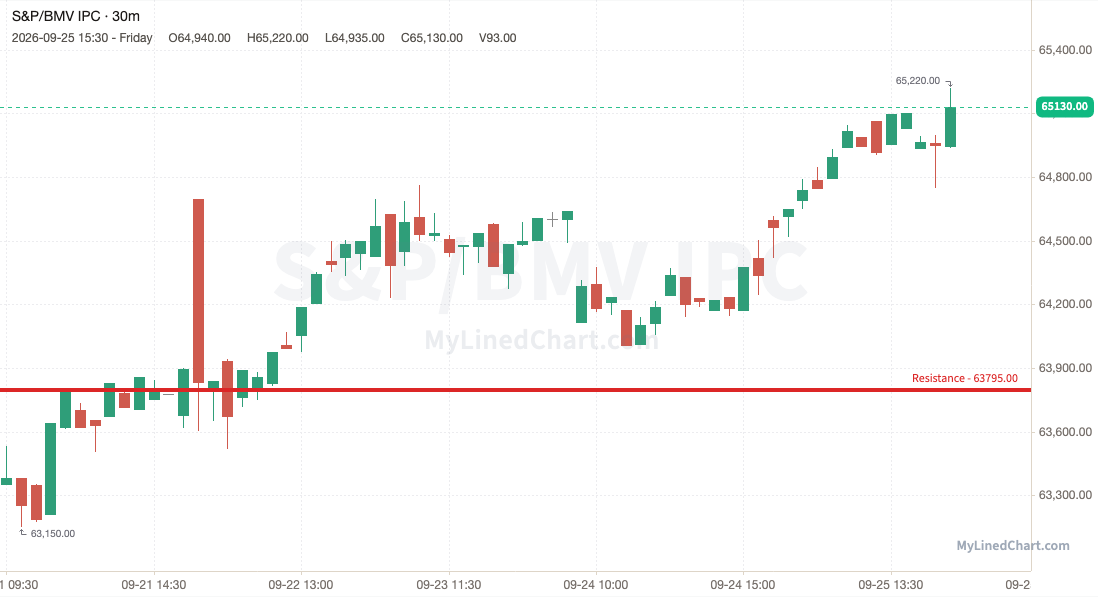
S&P/BMV IPC (Mexico) +1.59%
A midweek shakeout dragged S&P/BMV IPC down to 64150 beneath 64955 before it recovered the line and settled at 66060, at the top of its weekly range.
Busiest levels this week:
S&P/BMV IPC 65175: most volume, 58 contracts, touched 4 times
S&P/BMV IPC 65189: 2nd most, 55 contracts, touched 4 times
S&P/BMV IPC 65182: 3rd most, 54 contracts, touched 3 times
Ibovespa (Brazil) -0.95%
Ibovespa broke the 210025 support and couldn't get back above it, closing at 209000, mid-range for the week.
Busiest levels this week:
Ibovespa 209280: most volume, 2898 contracts, touched 7 times
Ibovespa 209160: 2nd most, 2706 contracts, touched 7 times
Ibovespa 209000: 3rd most, 2636 contracts, touched 10 times
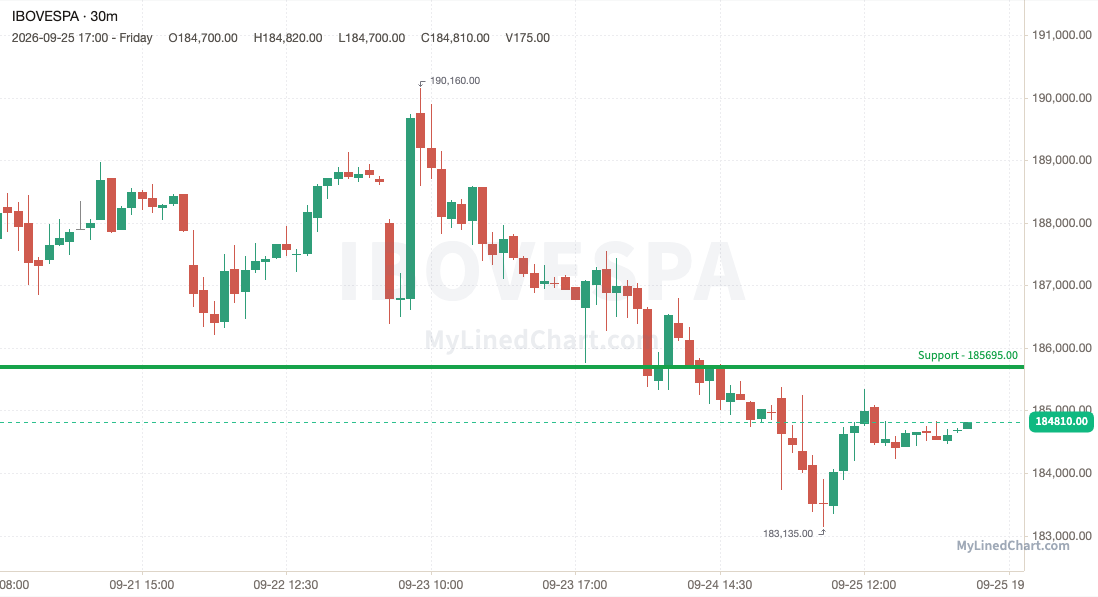
Touches show how often traders defended a price; each test can wear it down. Volume shows how much trading happened there, and heavy-volume prices tend to pull price back because many traders hold positions there.
See the latest daily SPY, ES, QQQ & NQ levels, posted the evening before the next day's session.
MyLinedChart turns your technical analysis into trading rules. Draw your levels, export your entire chart to XLSX, and turn your rules into trades. Or, have Claude, Codex, or Cursor do the work for you.
Not financial advice. Objective market structure and levels only. You make and own your trades.