
SPY, ES Day Trade Levels: Nov 16-20 Week in Review and Chart Pack
Published · Lee H.
A red week: all 4 finished lower, with the week's low on Friday, November 20.
How each one played out
SPY (S&P 500 ETF) -7.84%
SPY lost 745.49 and stayed under it, ending the week at 690.87, down at the lows.
Busiest levels this week:
SPY 731.05: most volume, 4958415 shares, touched 18 times
SPY 729.82: 2nd most, 3850031 shares, touched 11 times
SPY 737.25: 3rd most, 3065083 shares, touched 13 times
ES (E-mini S&P 500 futures) -7.42%
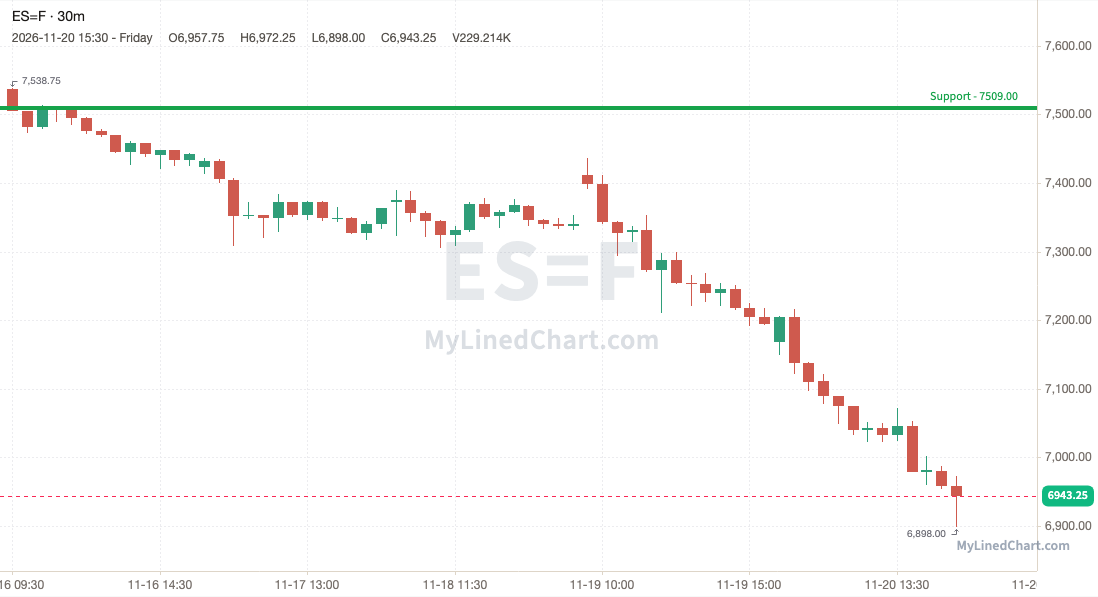
The 7509 support gave way for ES, which closed below it at 6978.75, at the bottom of its weekly range.
Busiest levels this week:
ES 7344: most volume, 77316 contracts, touched 6 times
ES 7348.25: 2nd most, 72239 contracts, touched 16 times
ES 7340: 3rd most, 70999 contracts, touched 6 times
QQQ (Nasdaq 100 ETF) -9.08%
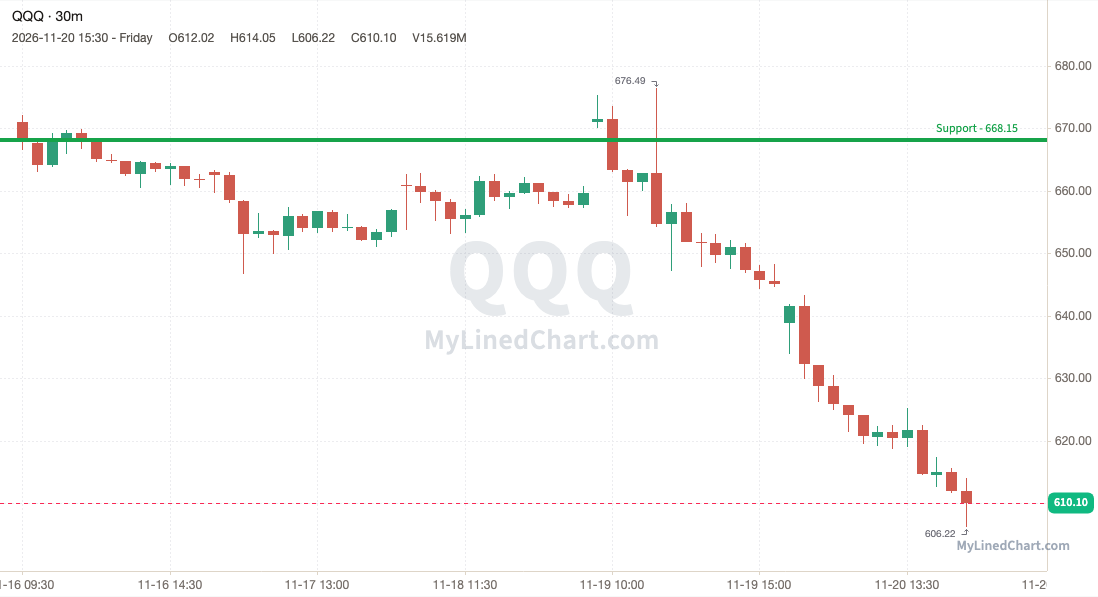
QQQ broke the 668.15 support and couldn't get back above it, closing at 610.10, near the week's low.
Busiest levels this week:
QQQ 659.87: most volume, 4724410 shares, touched 16 times
QQQ 657.76: 2nd most, 4520101 shares, touched 13 times
QQQ 654.15: 3rd most, 4375422 shares, touched 5 times
NQ (E-mini Nasdaq 100 futures) -8.47%
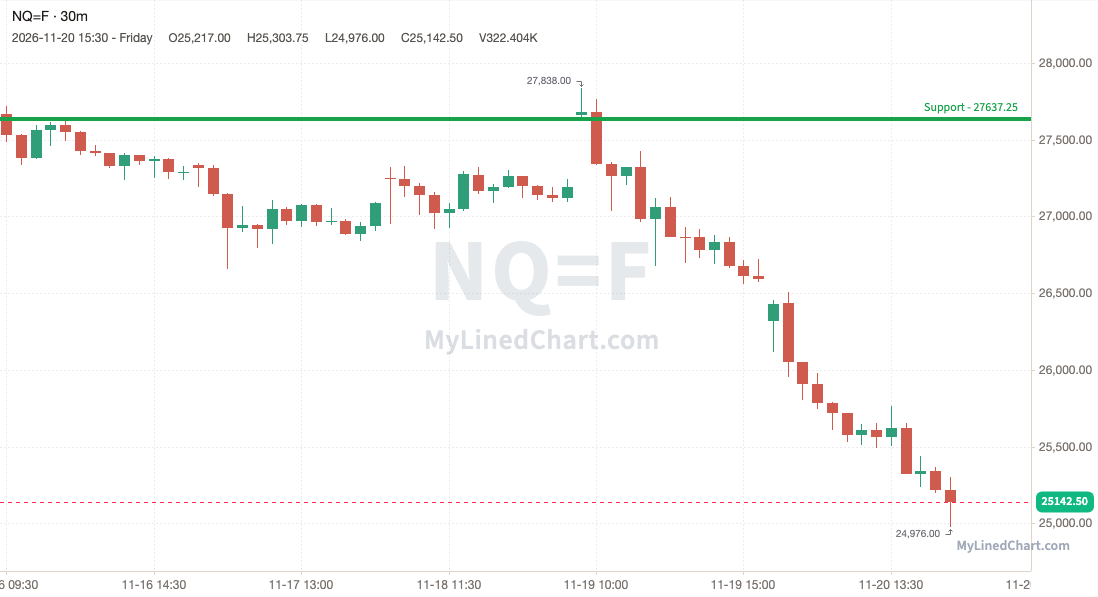
NQ lost 27637.25 and stayed under it, ending the week at 25325.50, down at the lows.
Busiest levels this week:
NQ 27168.25: most volume, 41006 contracts, touched 3 times
NQ 27162.50: 2nd most, 40824 contracts, touched 3 times
NQ 27148.50: 3rd most, 34987 contracts, touched 3 times
Active Traders
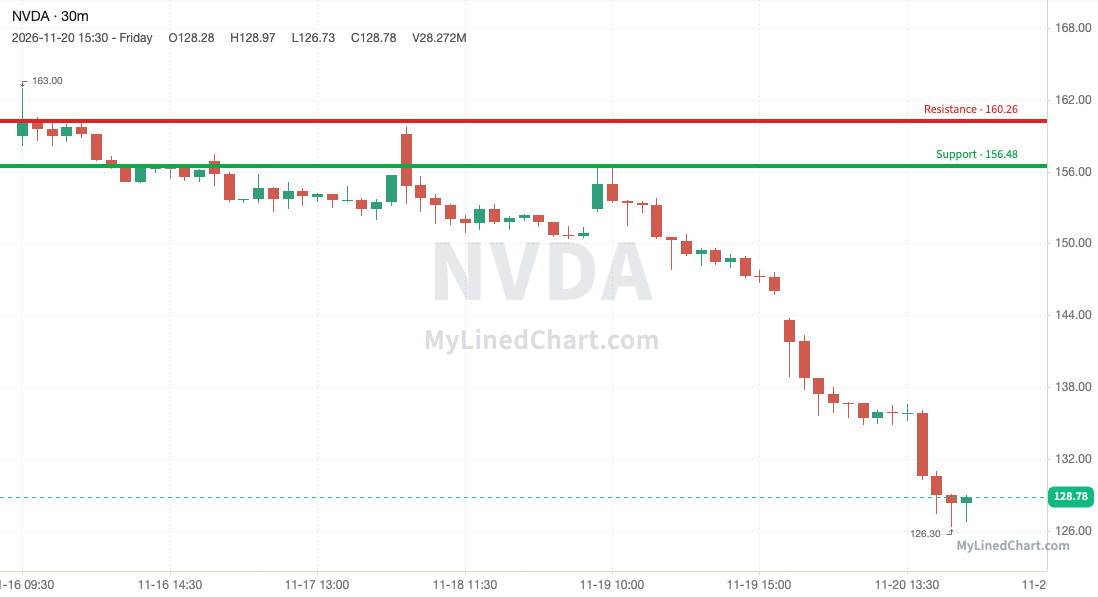
NVDA (NVIDIA) -19.01%
The 156.48 support gave way for NVDA, which closed below it at 128.78, at the bottom of its weekly range.
Busiest levels this week:
NVDA 153.75: most volume, 7665434 shares, touched 9 times
NVDA 164.74: 2nd most, 7559967 shares, touched 4 times
NVDA 153.67: 3rd most, 6440638 shares, touched 9 times
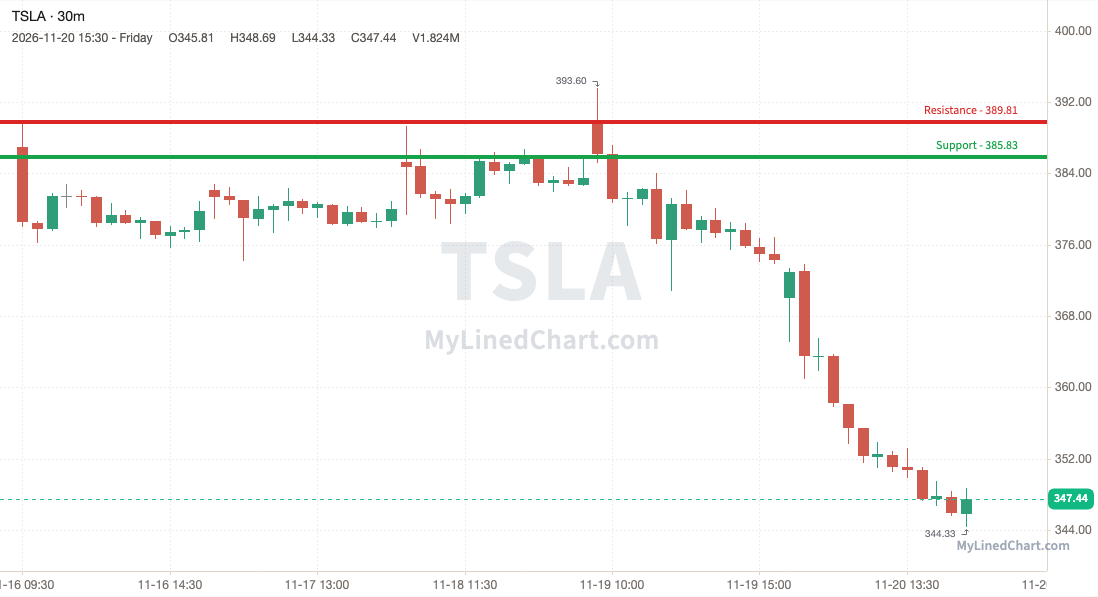
TSLA (Tesla) -10.22%
TSLA broke the 385.83 support and couldn't get back above it, closing at 347.44, near the week's low.
Busiest levels this week:
TSLA 376.23: most volume, 2723054 shares, touched 19 times
TSLA 378.40: 2nd most, 2420428 shares, touched 21 times
TSLA 378.07: 3rd most, 1102567 shares, touched 13 times
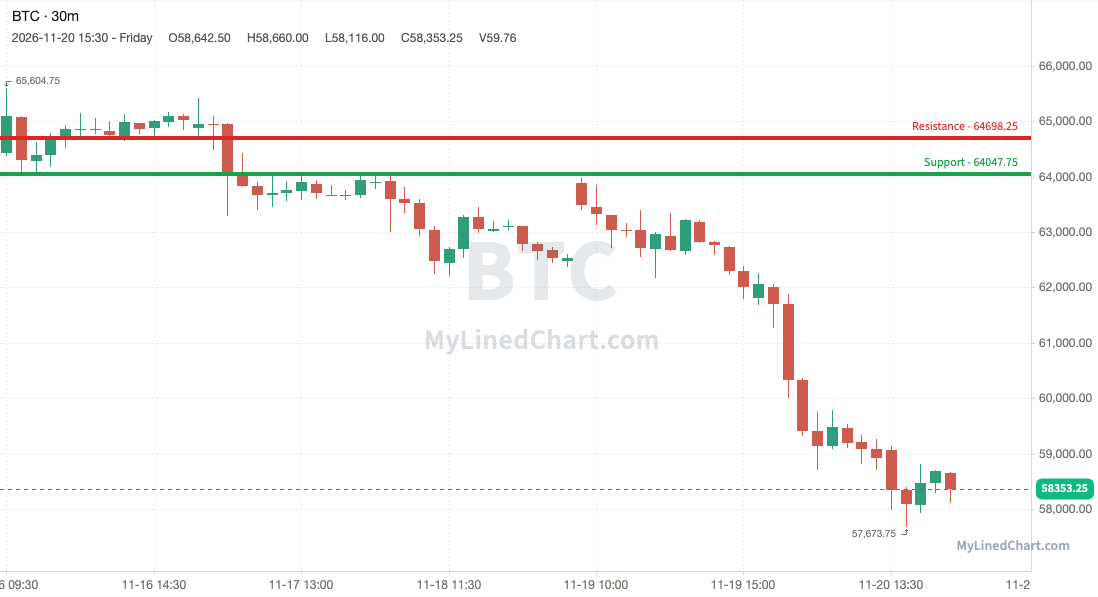
BTC (Bitcoin) -9.44%
BTC lost 64047.75 and stayed under it, ending the week at 58353.25, down at the lows.
Busiest levels this week:
BTC 63981.50: most volume, 77 BTC, touched 49 times
BTC 62596.75: 2nd most, 21 BTC, touched 25 times
BTC 61950.50: 3rd most, 15 BTC, touched 12 times
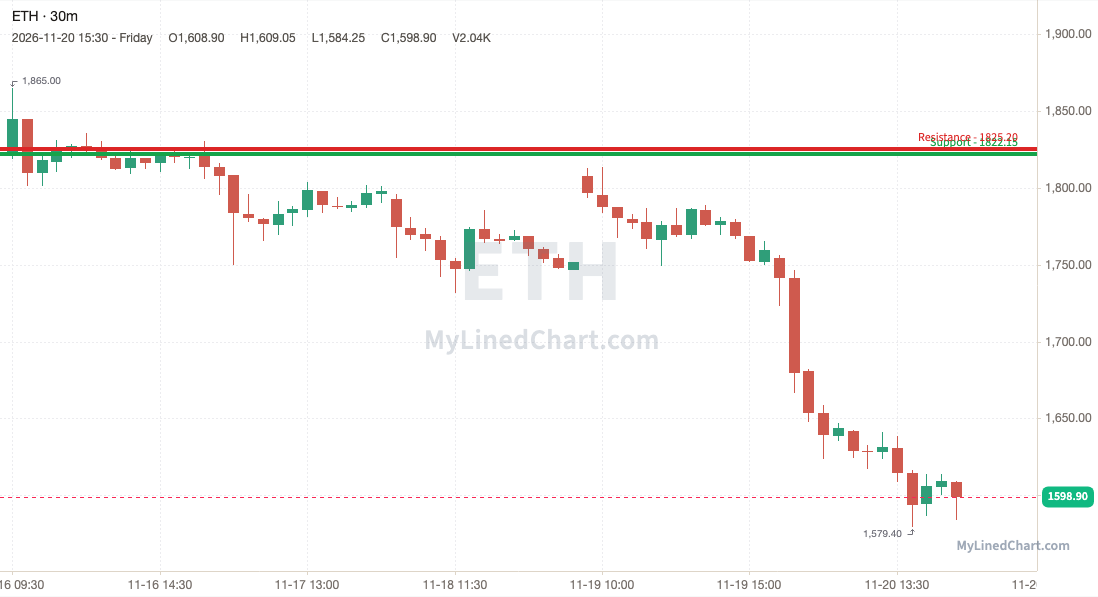
ETH (Ethereum) -12.31%
The 1822.15 support gave way for ETH, which closed below it at 1598.90, at the bottom of its weekly range.
Busiest levels this week:
ETH 1793.45: most volume, 912 ETH, touched 14 times
ETH 1773.60: 2nd most, 303 ETH, touched 7 times
ETH 1757: 3rd most, 245 ETH, touched 4 times
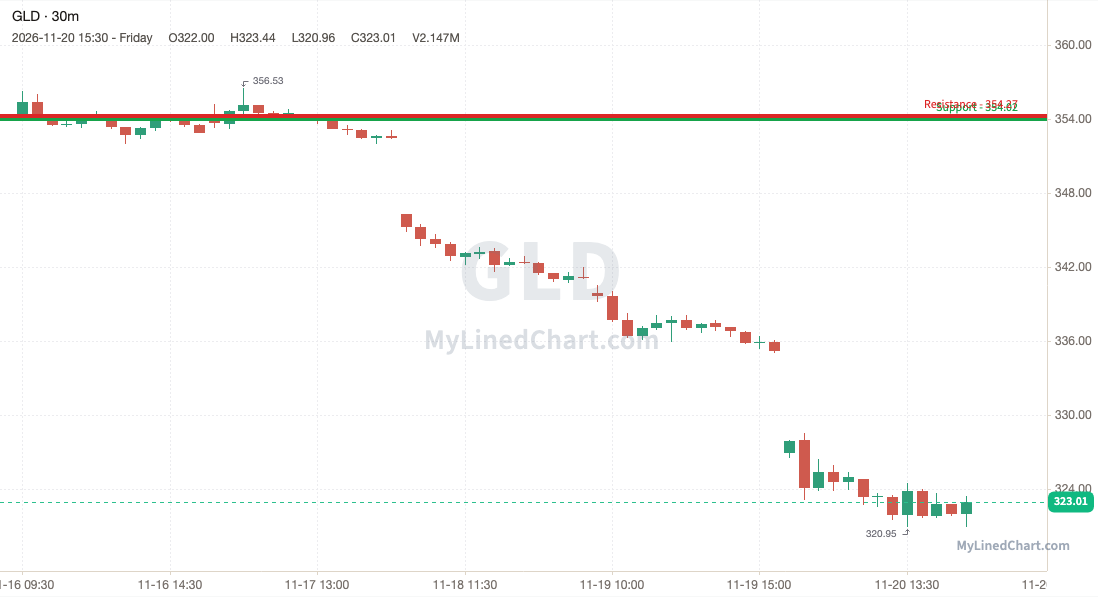
GLD (SPDR Gold Shares) -8.79%
GLD broke the 354.02 support and couldn't get back above it, closing at 323.01, near the week's low.
Busiest levels this week:
GLD 355.07: most volume, 559872 shares, touched 4 times
GLD 355.44: 2nd most, 508210 shares, touched 4 times
GLD 355.06: 3rd most, 493703 shares, touched 3 times
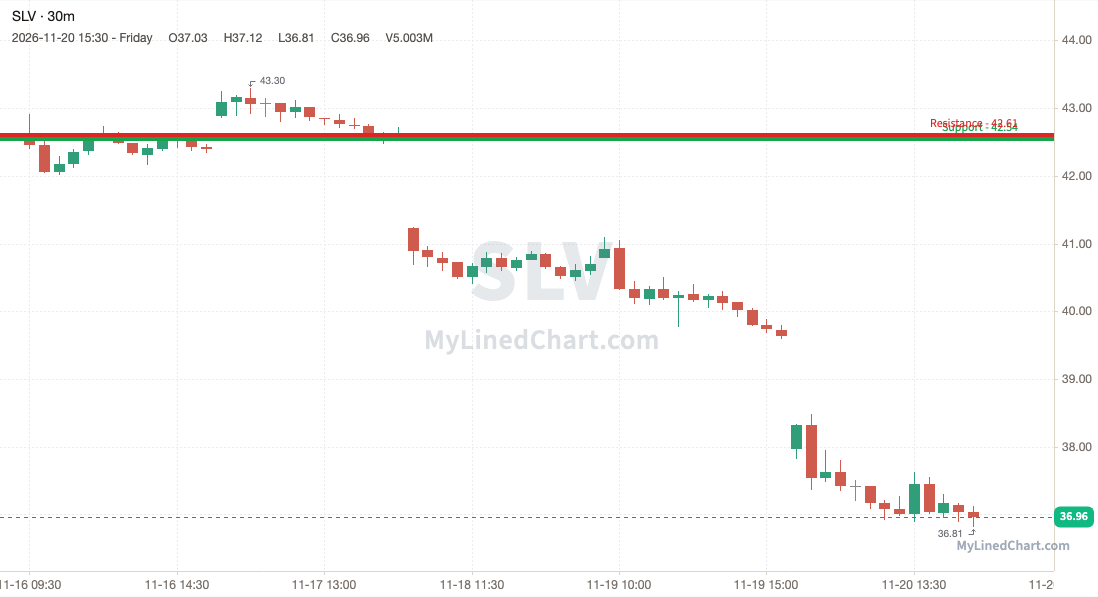
SLV (iShares Silver Trust) -13.22%
SLV lost 42.54 and stayed under it, ending the week at 36.96, down at the lows.
Busiest levels this week:
SLV 44.81: most volume, 3535240 shares, touched 15 times
SLV 40.65: 2nd most, 3217020 shares, touched 12 times
SLV 40.83: 3rd most, 2229777 shares, touched 9 times
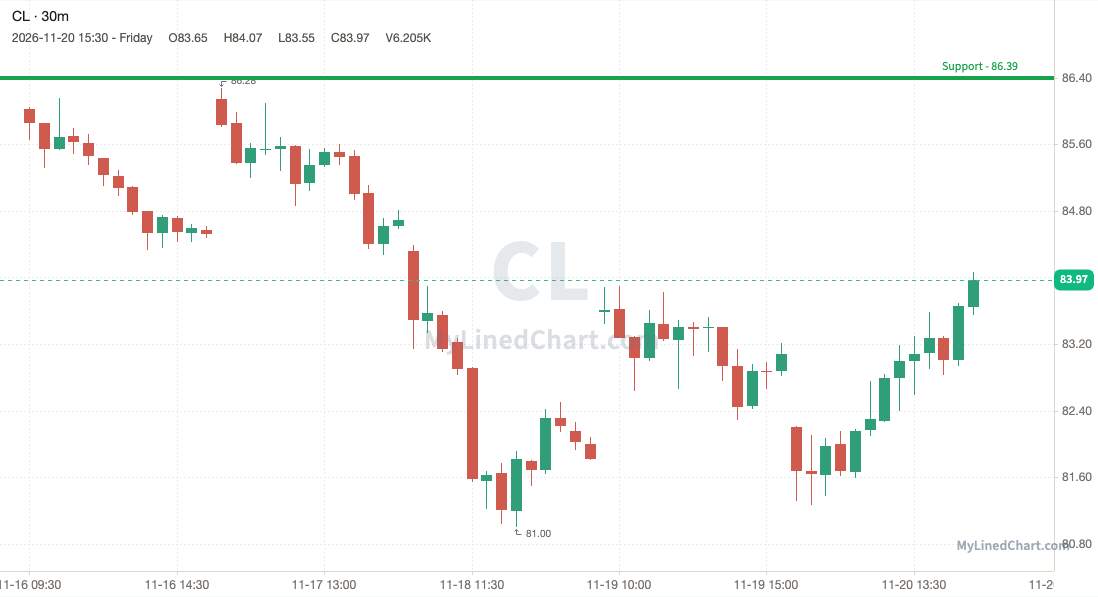
CL (Crude Oil futures) -3.54%
The 86.39 support gave way for CL, which closed below it at 83.97, around the middle of its weekly range.
Busiest levels this week:
CL 83.15: most volume, 15269 contracts, touched 20 times
CL 85.20: 2nd most, 13069 contracts, touched 29 times
CL 82.94: 3rd most, 10330 contracts, touched 14 times
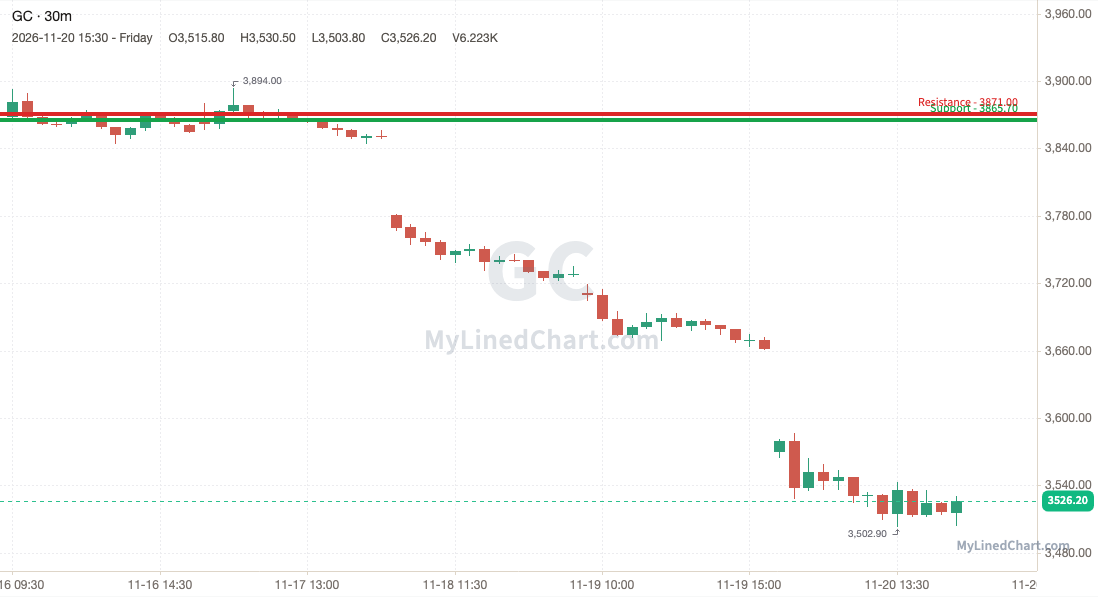
GC (Gold futures) -8.85%
GC broke the 3865.70 support and couldn't get back above it, closing at 3526.20, near the week's low.
Busiest levels this week:
GC 3884.60: most volume, 6399 contracts, touched 17 times
GC 3880.50: 2nd most, 5522 contracts, touched 17 times
GC 3861.80: 3rd most, 5137 contracts, touched 9 times
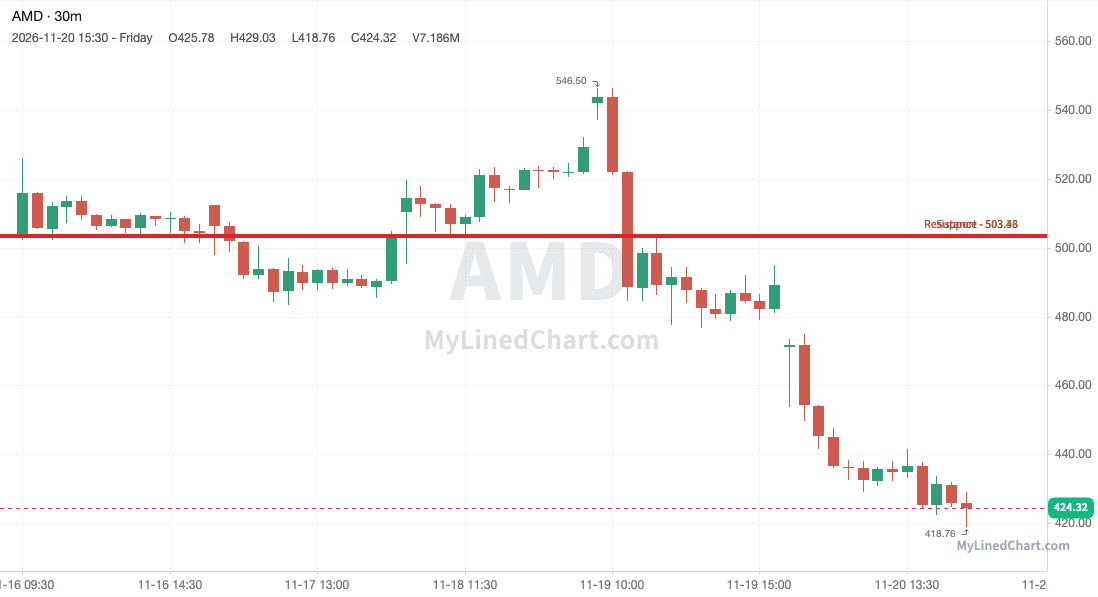
AMD (Advanced Micro Devices) -15.72%
AMD lost 503.33 and stayed under it, ending the week at 424.32, down at the lows.
Busiest levels this week:
AMD 489.48: most volume, 1270445 shares, touched 3 times
AMD 489.11: 2nd most, 1259797 shares, touched 14 times
AMD 503.70: 3rd most, 865348 shares, touched 6 times
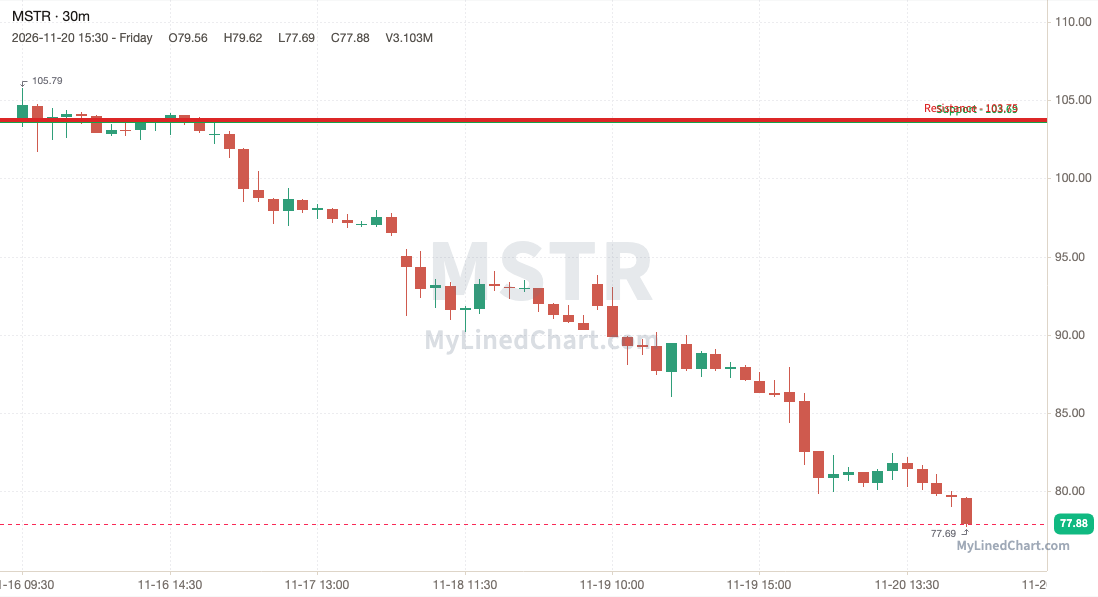
MSTR (Strategy) -24.92%
The 103.69 support gave way for MSTR, which closed below it at 77.88, at the bottom of its weekly range.
Busiest levels this week:
MSTR 96.17: most volume, 2092986 shares, touched 41 times
MSTR 96.66: 2nd most, 2047347 shares, touched 18 times
MSTR 86.04: 3rd most, 1356576 shares, touched 6 times
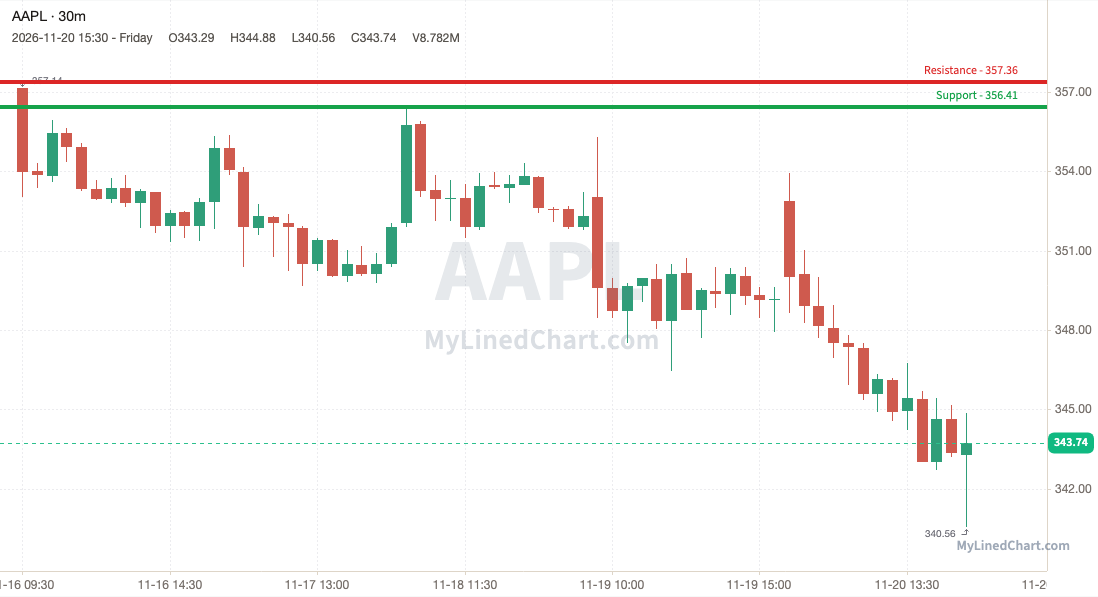
AAPL (Apple) -3.75%
AAPL broke the 356.41 support and couldn't get back above it, closing at 343.74, near the week's low.
Busiest levels this week:
AAPL 349.10: most volume, 1981791 shares, touched 9 times
AAPL 348.92: 2nd most, 1941116 shares, touched 6 times
AAPL 348.82: 3rd most, 1904913 shares, touched 4 times
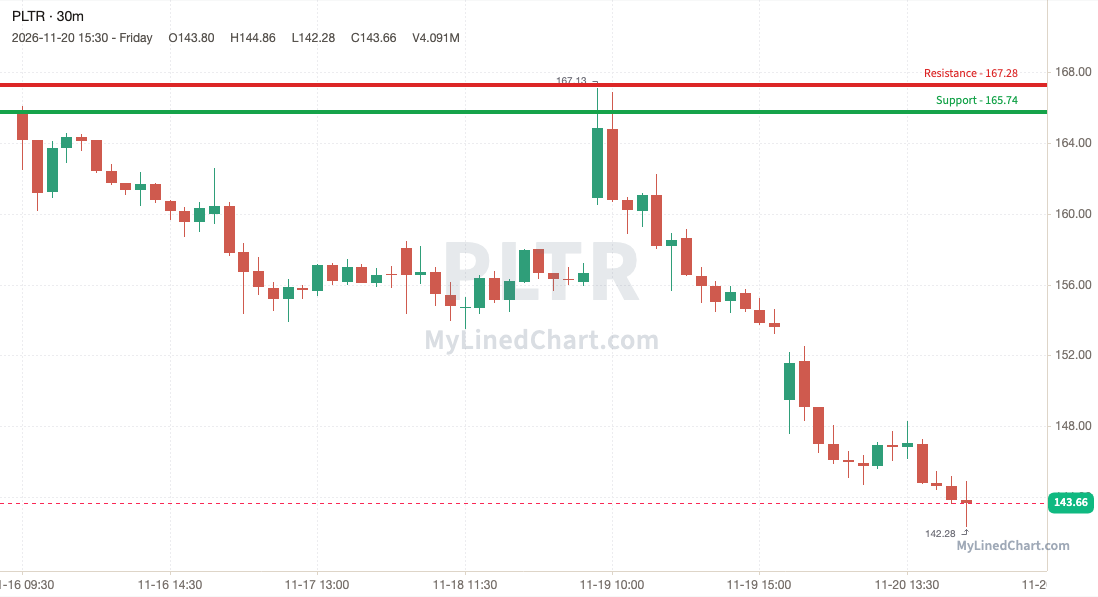
PLTR (Palantir) -13.33%
PLTR lost 165.74 and stayed under it, ending the week at 143.66, down at the lows.
Busiest levels this week:
PLTR 156.29: most volume, 1920506 shares, touched 11 times
PLTR 156.88: 2nd most, 1787402 shares, touched 8 times
PLTR 156.58: 3rd most, 1665514 shares, touched 5 times
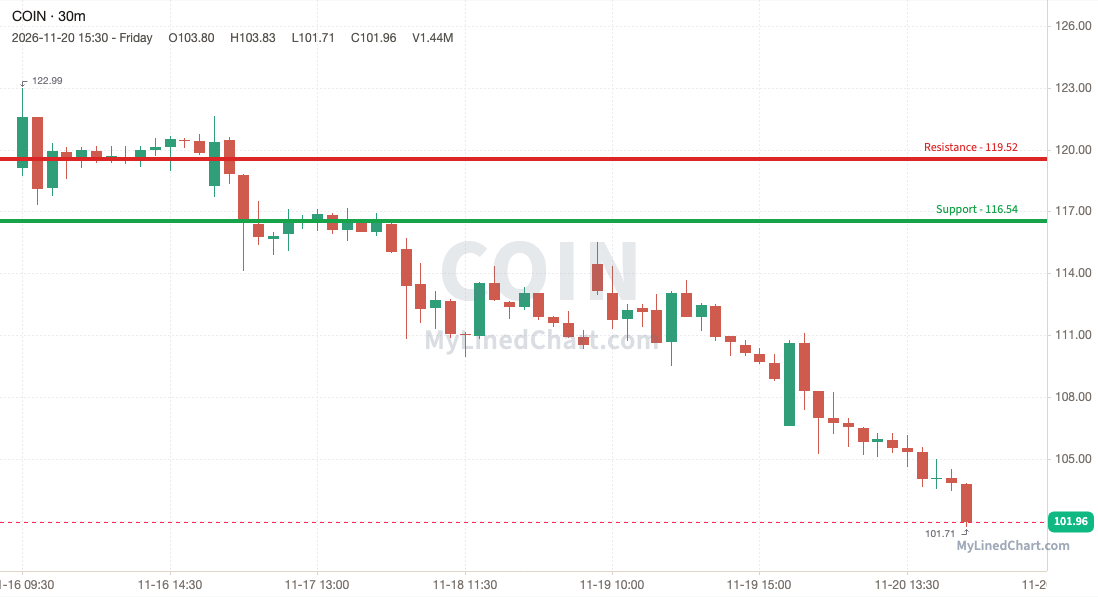
COIN (Coinbase) -14.41%
The 116.54 support gave way for COIN, which closed below it at 101.96, at the bottom of its weekly range.
Busiest levels this week:
COIN 119.93: most volume, 253010 shares, touched 4 times
COIN 119.70: 2nd most, 229743 shares, touched 4 times
COIN 120.14: 3rd most, 216382 shares, touched 8 times
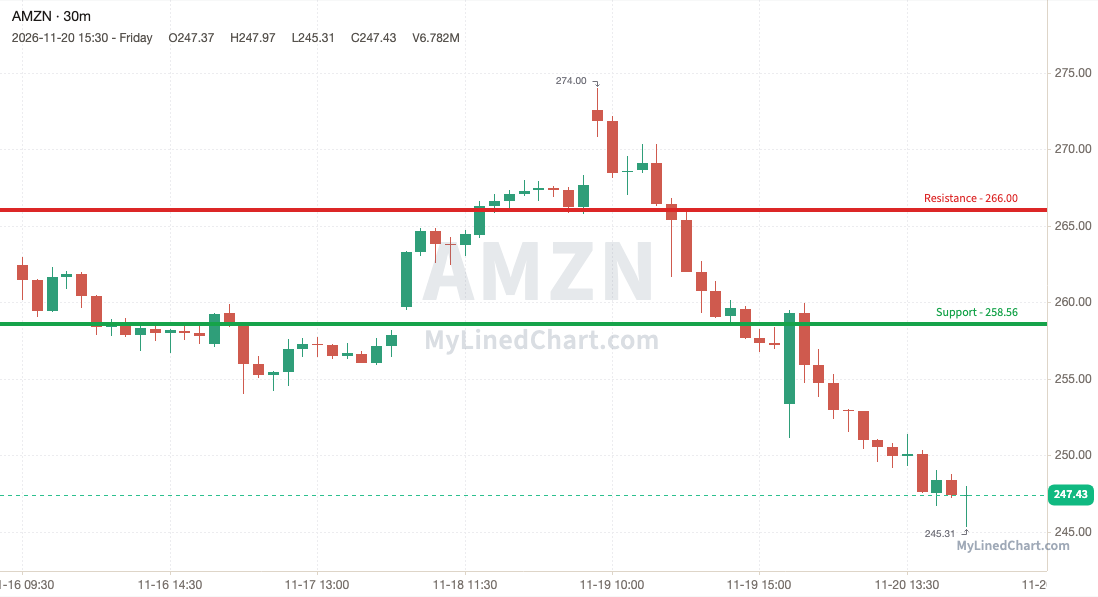
AMZN (Amazon) -5.71%
AMZN broke the 258.56 support and couldn't get back above it, closing at 247.43, near the week's low.
Busiest levels this week:
AMZN 256.98: most volume, 3658698 shares, touched 20 times
AMZN 257.48: 2nd most, 3050449 shares, touched 12 times
AMZN 267.92: 3rd most, 2159700 shares, touched 13 times
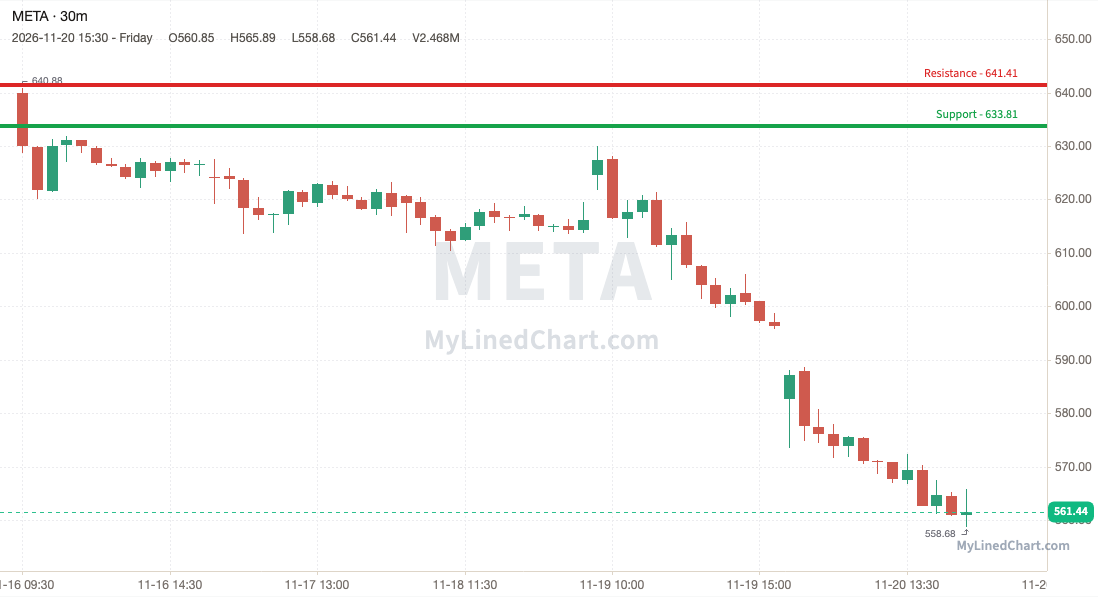
META (Meta Platforms) -12.27%
META lost 633.81 and stayed under it, ending the week at 561.44, down at the lows.
Busiest levels this week:
META 616.42: most volume, 704449 shares, touched 7 times
META 627.09: 2nd most, 502563 shares, touched 4 times
META 596.01: 3rd most, 473187 shares, touched 4 times
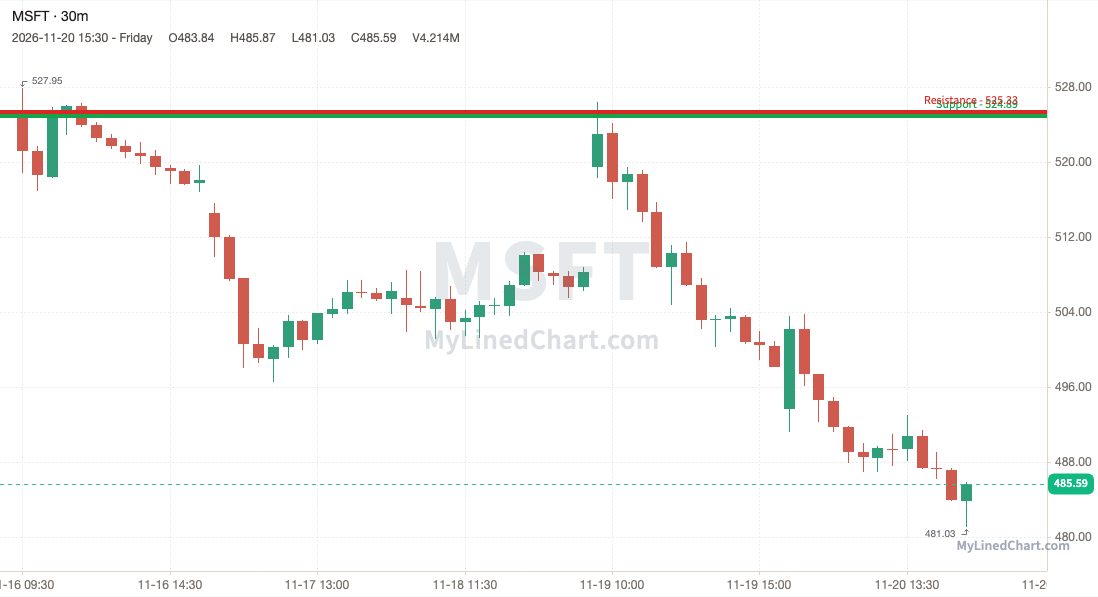
MSFT (Microsoft) -7.52%
The 524.89 support gave way for MSFT, which closed below it at 485.59, at the bottom of its weekly range.
Busiest levels this week:
MSFT 498.41: most volume, 1088692 shares, touched 14 times
MSFT 498.02: 2nd most, 999964 shares, touched 9 times
MSFT 498.11: 3rd most, 963965 shares, touched 3 times
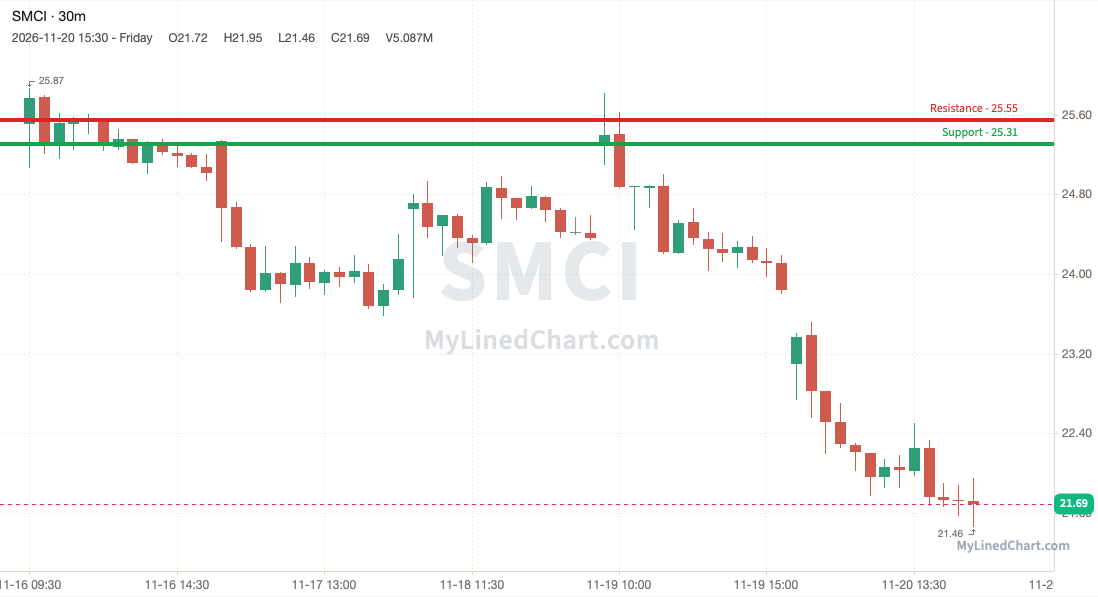
SMCI (Super Micro Computer) -14.97%
SMCI broke the 25.31 support and couldn't get back above it, closing at 21.69, near the week's low.
Busiest levels this week:
SMCI 26.51: most volume, 4682899 shares, touched 12 times
SMCI 26.96: 2nd most, 4670124 shares, touched 12 times
SMCI 26.66: 3rd most, 4449632 shares, touched 10 times
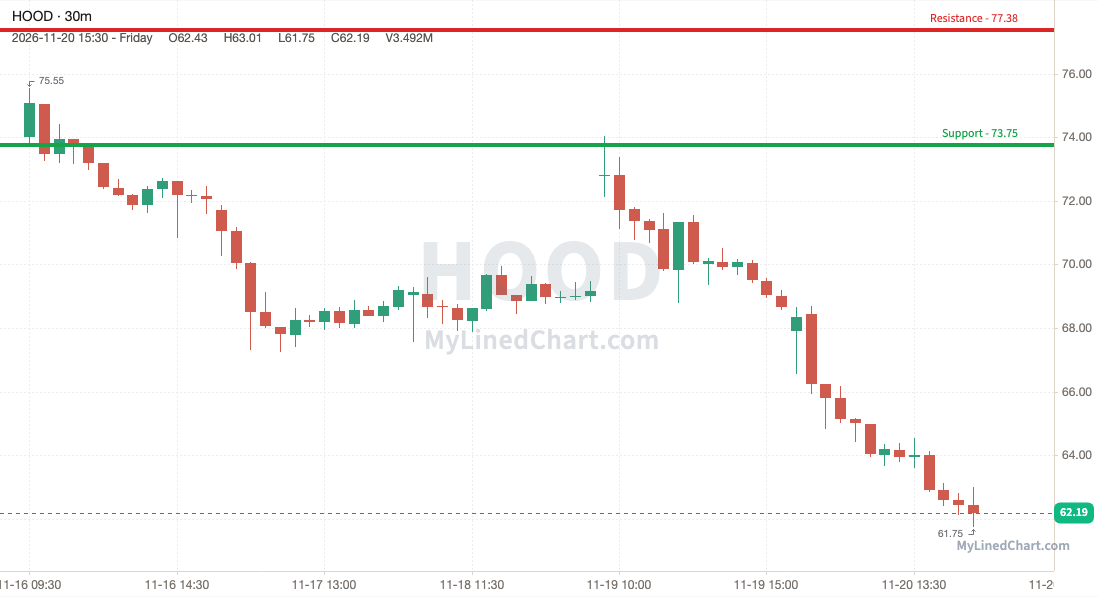
HOOD (Robinhood) -15.95%
HOOD lost 73.75 and stayed under it, ending the week at 62.19, down at the lows.
Busiest levels this week:
HOOD 73.75: most volume, 1255135 shares, touched 17 times
HOOD 69.03: 2nd most, 1063256 shares, touched 8 times
HOOD 68.59: 3rd most, 980300 shares, touched 14 times
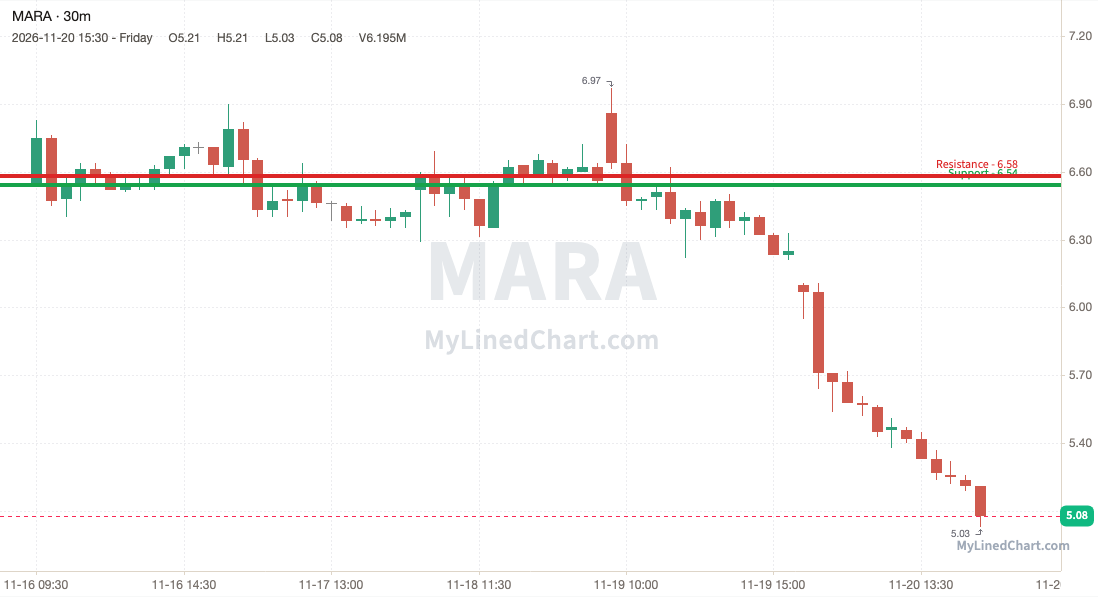
MARA (MARA Holdings) -22.44%
The 6.54 support gave way for MARA, which closed below it at 5.08, at the bottom of its weekly range.
Busiest levels this week:
MARA 6.59: most volume, 18287249 shares, touched 36 times
MARA 6.58: 2nd most, 17465749 shares, touched 32 times
MARA 6.92: 3rd most, 15430036 shares, touched 16 times
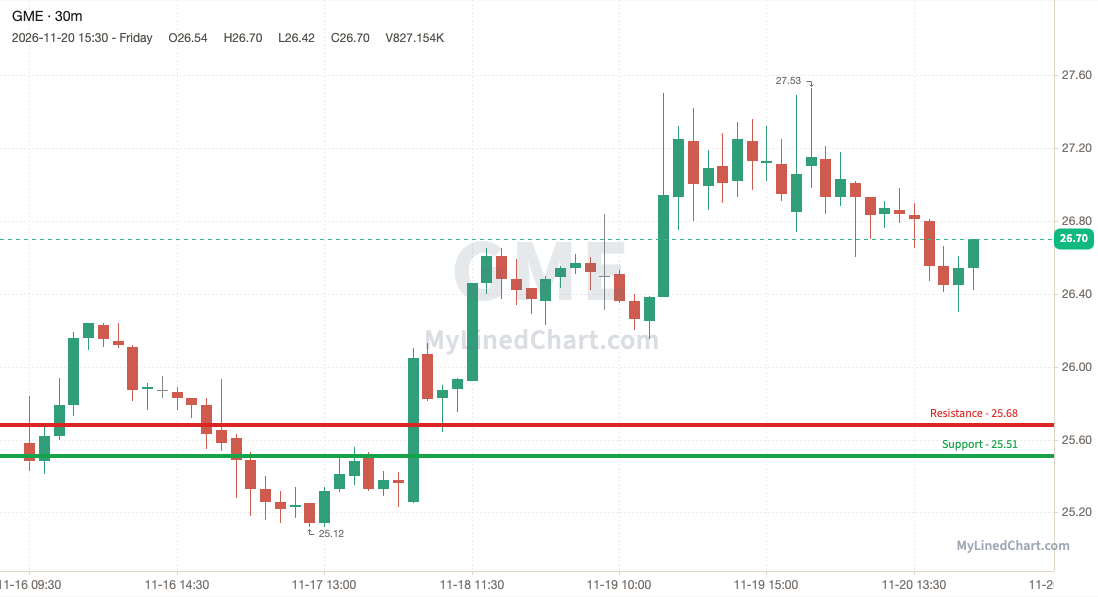
GME (GameStop) +4.38%
GME dipped under 25.51 to 25.12, then bought back up to close the week at 26.70, mid-range for the week.
Busiest levels this week:
GME 25.09: most volume, 2906355 shares, touched 37 times
GME 26.85: 2nd most, 1630895 shares, touched 24 times
GME 26.05: 3rd most, 1508007 shares, touched 31 times
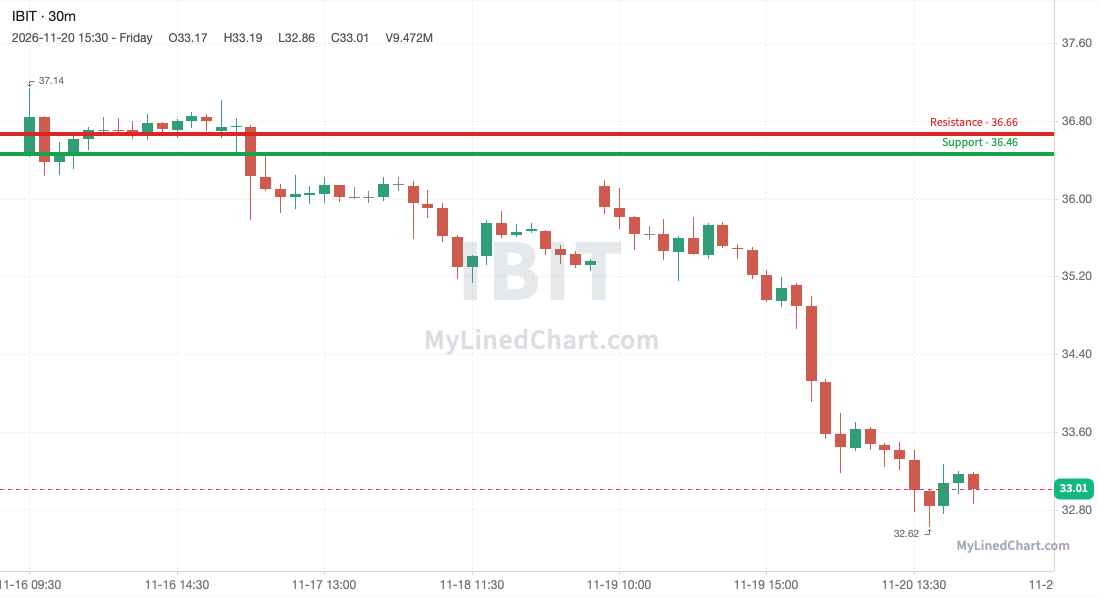
IBIT (iShares Bitcoin Trust) -9.49%
IBIT lost 36.46 and stayed under it, ending the week at 33.01, down at the lows.
Busiest levels this week:
IBIT 35.84: most volume, 23504842 shares, touched 80 times
IBIT 35: 2nd most, 19291636 shares, touched 50 times
IBIT 37: 3rd most, 16980461 shares, touched 33 times
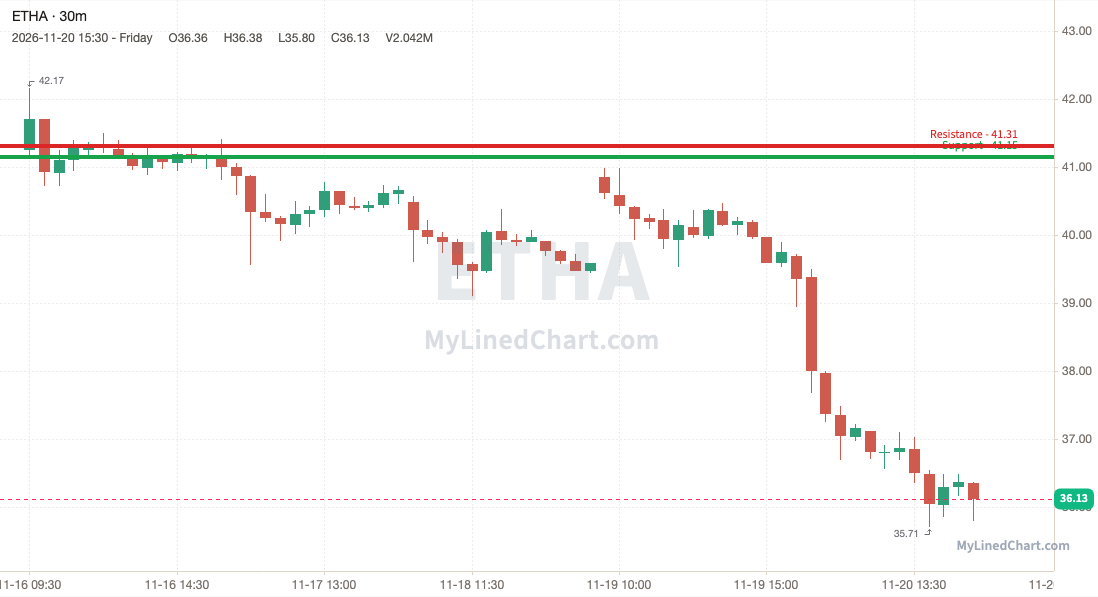
ETHA (iShares Ethereum Trust) -12.41%
The 41.15 support gave way for ETHA, which closed below it at 36.13, at the bottom of its weekly range.
Busiest levels this week:
ETHA 39.76: most volume, 1797599 shares, touched 6 times
ETHA 40.78: 2nd most, 1635930 shares, touched 25 times
ETHA 40.10: 3rd most, 1315835 shares, touched 15 times
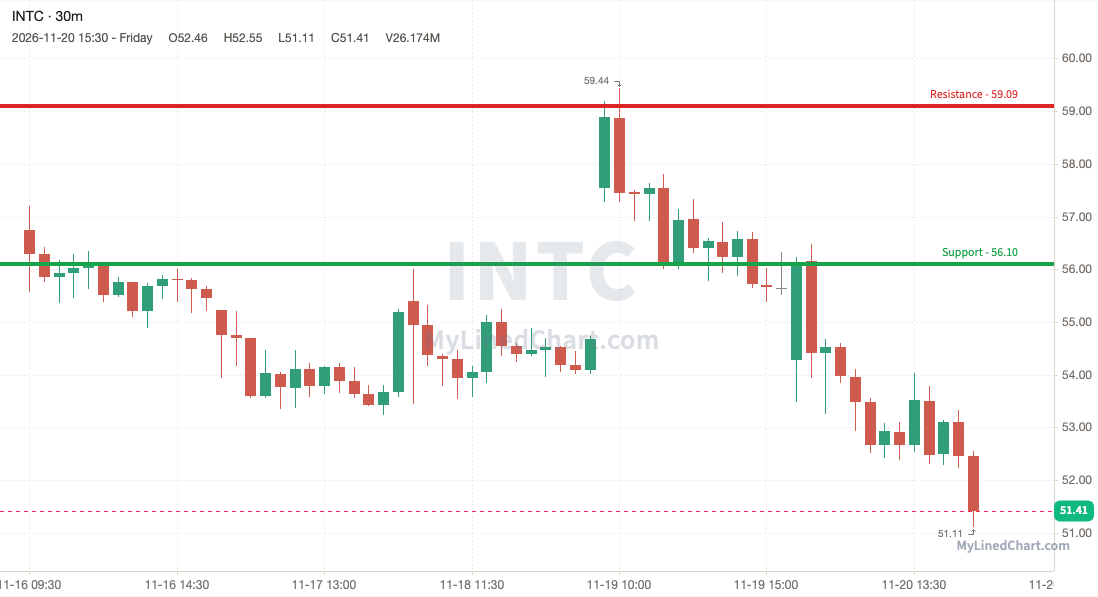
INTC (Intel) -9.41%
INTC broke the 56.10 support and couldn't get back above it, closing at 51.41, near the week's low.
Busiest levels this week:
INTC 60.01: most volume, 6624482 shares, touched 4 times
INTC 55.69: 2nd most, 5872918 shares, touched 11 times
INTC 54.26: 3rd most, 5402224 shares, touched 5 times
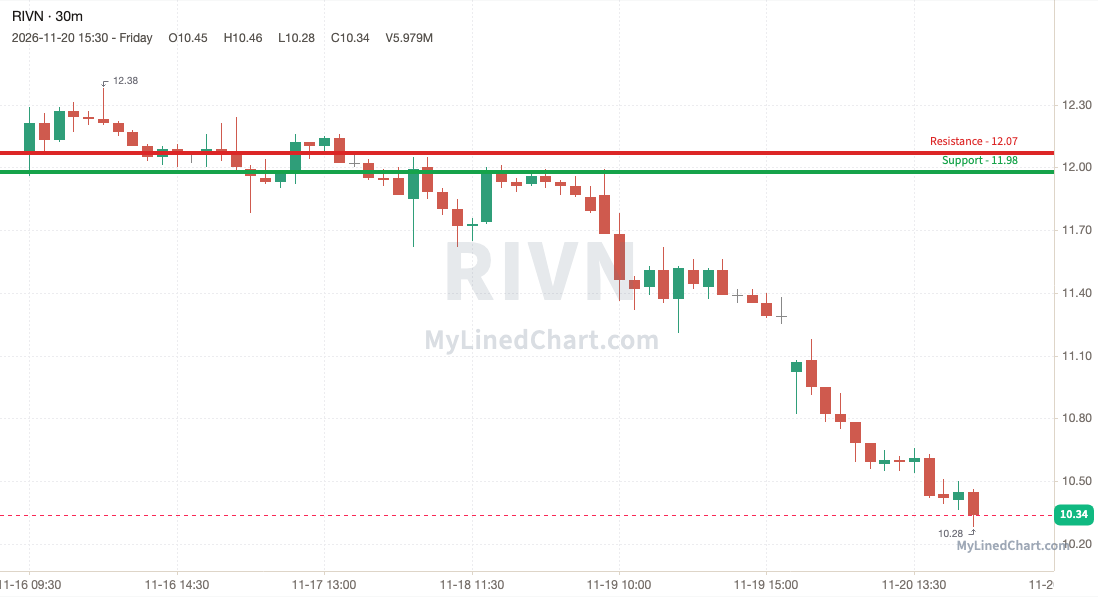
RIVN (Rivian) -14.26%
RIVN lost 11.98 and stayed under it, ending the week at 10.34, down at the lows.
Busiest levels this week:
RIVN 11.62: most volume, 20659567 shares, touched 61 times
RIVN 11.65: 2nd most, 18588884 shares, touched 51 times
RIVN 11.81: 3rd most, 12881108 shares, touched 35 times
See the Active Traders trade plan
Touches show how often traders defended a price; each test can wear it down. Volume shows how much trading happened there, and heavy-volume prices tend to pull price back because many traders hold positions there.
Levels for the week ahead
SPY
SPY closed the week at 690.87. For the week ahead the weekly pivot is 709.14, with R1 at 731.52 and S1 at 668.48. Last week's range ran from 686.75 to 749.79.
| Weekly level | Price | From the close |
|---|---|---|
| Last week high | 749.79 | +58.92 |
| Weekly R1 | 731.52 | +40.65 |
| Weekly pivot | 709.14 | +18.27 |
| Last week low | 686.75 | -4.12 |
| Weekly S1 | 668.48 | -22.39 |
ES
ES closed the week at 6978.75. For the week ahead the weekly pivot is 7138.50, with R1 at 7379 and S1 at 6738.25. Last week's range ran from 6898 to 7538.75.
| Weekly level | Price | From the close |
|---|---|---|
| Last week high | 7538.75 | +560 |
| Weekly R1 | 7379 | +400.25 |
| Weekly pivot | 7138.50 | +159.75 |
| Last week low | 6898 | -80.75 |
| Weekly S1 | 6738.25 | -240.50 |
QQQ
QQQ closed the week at 610.10. For the week ahead the weekly pivot is 630.94, with R1 at 655.65 and S1 at 585.38. Last week's range ran from 606.22 to 676.49.
| Weekly level | Price | From the close |
|---|---|---|
| Last week high | 676.49 | +66.39 |
| Weekly R1 | 655.65 | +45.55 |
| Weekly pivot | 630.94 | +20.84 |
| Last week low | 606.22 | -3.88 |
| Weekly S1 | 585.38 | -24.72 |
NQ
NQ closed the week at 25325.50. For the week ahead the weekly pivot is 26046.50, with R1 at 27117 and S1 at 24255. Last week's range ran from 24976 to 27838.
| Weekly level | Price | From the close |
|---|---|---|
| Last week high | 27838 | +2512.50 |
| Weekly R1 | 27117 | +1791.50 |
| Weekly pivot | 26046.50 | +721 |
| Last week low | 24976 | -349.50 |
| Weekly S1 | 24255 | -1070.50 |
US market calendar for the week of November 23 to 27
The US calendar for the week of November 23 to 27: 4 scheduled events, all times ET.
Wednesday, November 25
- 8:30 AM ET: GDP, Q3 second estimate (BEA)
- 8:30 AM ET: Personal Income and Outlays, PCE for October (BEA)
Thursday, November 26
- US markets closed for Thanksgiving
Friday, November 27
- 1:00 PM ET: US stock markets close early
See the latest daily SPY, ES, QQQ & NQ levels, posted the evening before the next day's session.
MyLinedChart turns your technical analysis into trading rules. Draw your levels, export your entire chart to XLSX, and turn your rules into trades. Or, have Claude, Codex, or Cursor do the work for you.
Not financial advice. Objective market structure and levels only. You make and own your trades.