
Active Traders · NVDA, TSLA, BTC, GLD, CL and more
META, MSTR, COIN, HOOD, MARA and 19 More Support and Resistance, Pivots and Highest Volume Levels for Day Traders, Nov 6
Published · Lee H.
MyLinedChart works however you get to a trade: AI-Assisted, Discretionary, Quant, or Macro. Export your lines, levels plus the whole chart as XLSX, JSON, or CSV. Or, let AI do all the work for you.
Here’s an overview of how MyLinedChart compares to TradingView and TrendSpider. Available on Windows, Apple and Android.
Looking for a pro to build your trading workflows? Reach out on Upwork.
A recap of how the November 5th trading session and levels played out:
NVDA (NVIDIA)
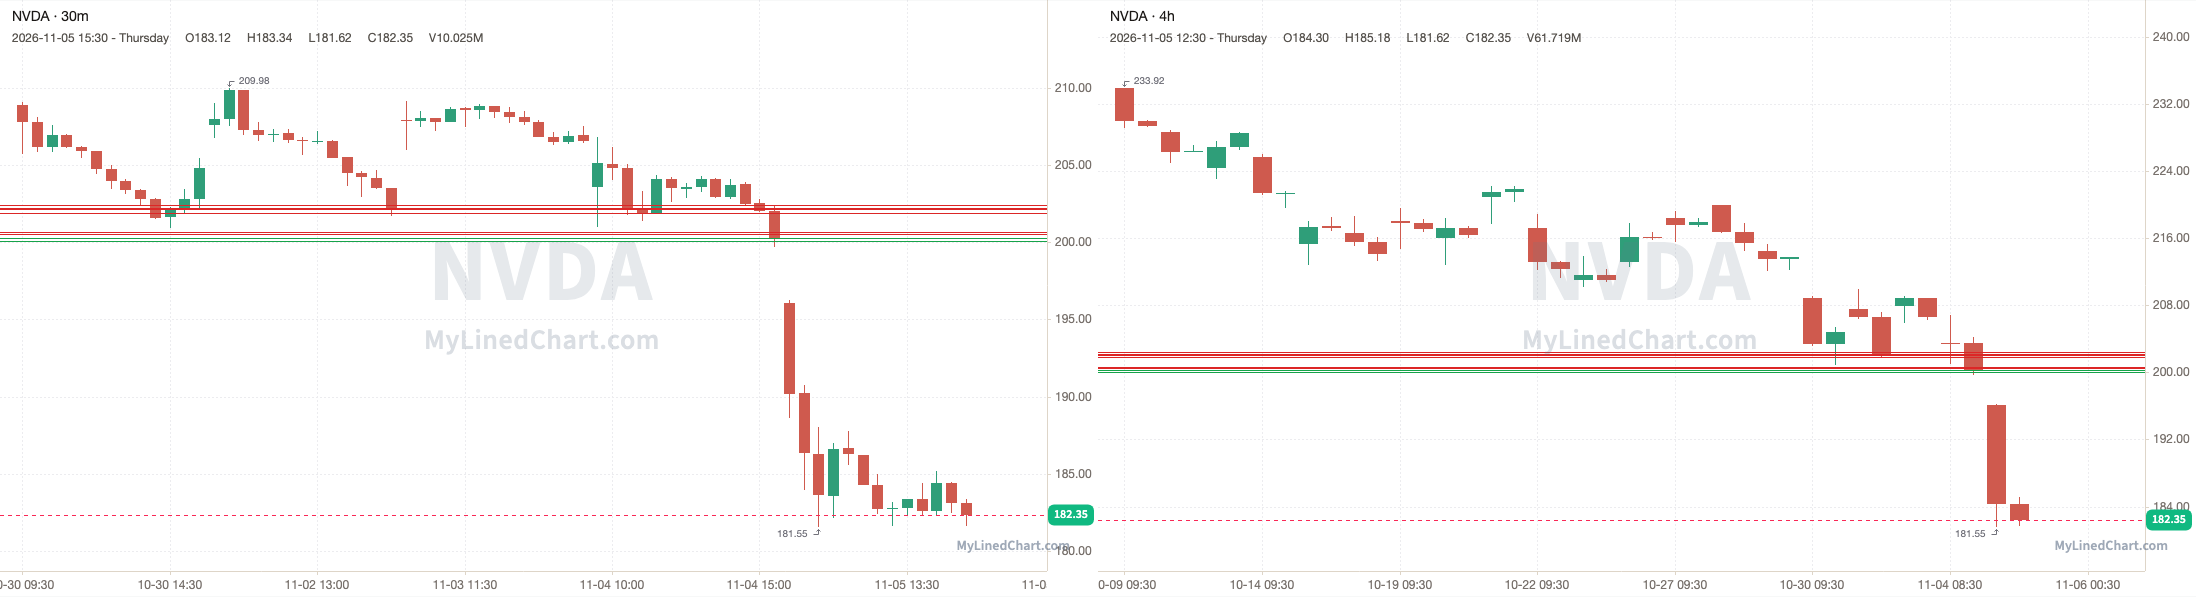
NVDA opened at 196.07, under the 200.27 pivot and every level in the plan, and never traded back up to them, with a high of 196.25 and a low of 181.55, then ended up closing at 182.35. Finishing the trading session down 7.00% intraday and down 8.95% overall.
November 5th session levels:
All listed levels: 200.08, 200.27, 200.52, 200.64, 201.86, 202.12, 202.20, 202.40
Resistance above: 200.52, 200.64, 201.86, 202.12, 202.20, 202.40
Support below: 200.27, 200.08
Nearest pivot: 200.27
Above 200.52 → 200.64 next
Lose 200.27 → 200.08 next
TSLA (Tesla)
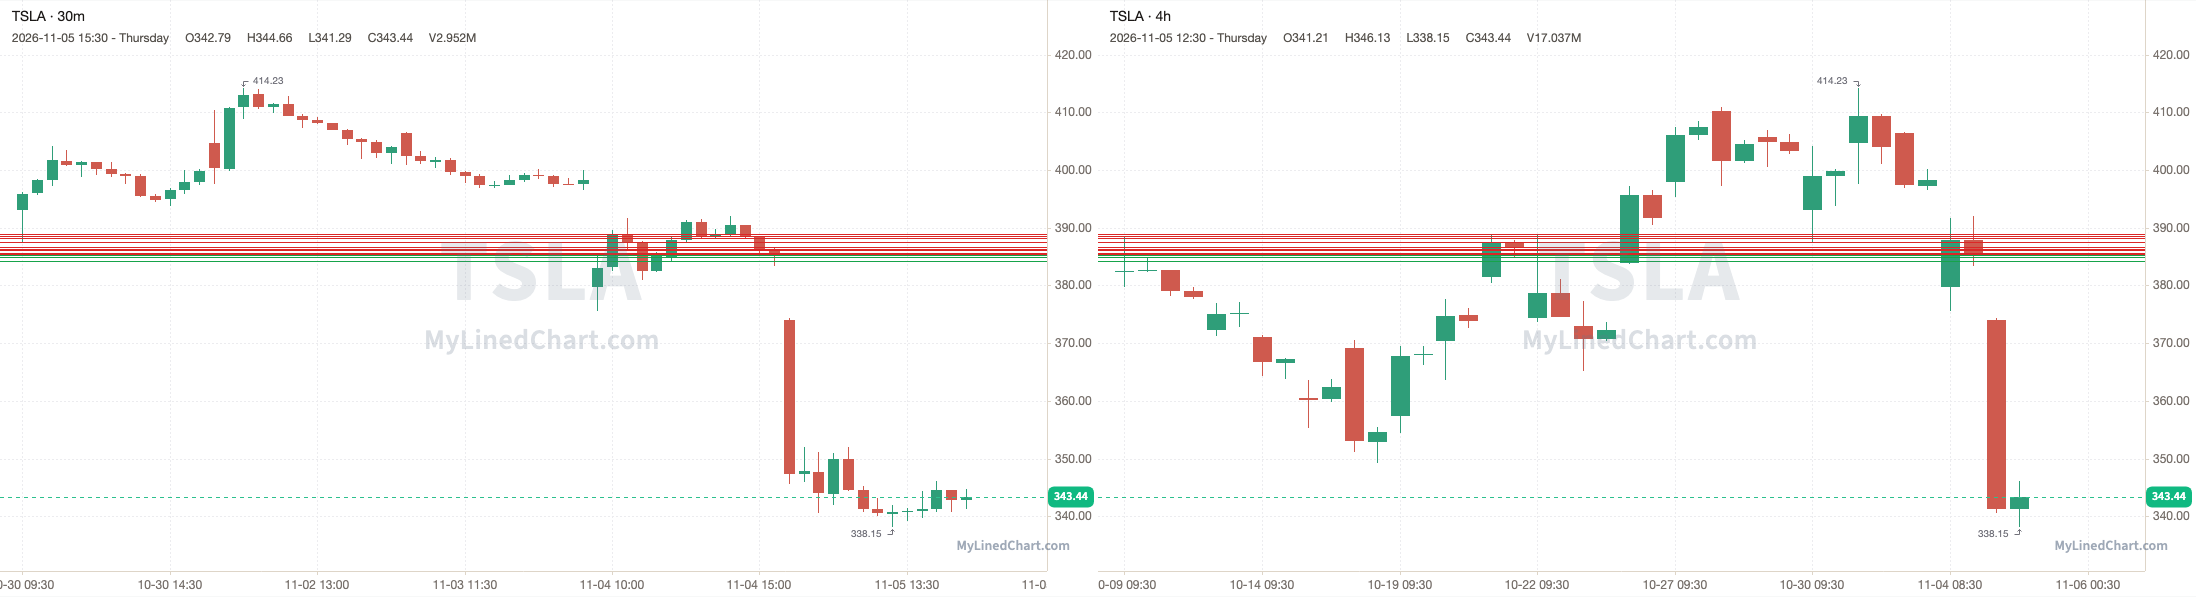
TSLA opened at 374.08, under the 385.22 pivot and every level in the plan, and never traded back up to them, with a high of 374.30 and a low of 338.15, then ended up closing at 343.44. Finishing the trading session down 8.19% intraday and down 10.86% overall.
November 5th session levels:
All listed levels: 384.27, 384.90, 385.22, 385.41, 385.59, 386.18, 386.25, 386.65, 387.54, 388.22, 388.54, 388.91
Resistance above: 385.41, 385.59, 386.18, 386.25, 386.65, 387.54, 388.22, 388.54, 388.91
Support below: 385.22, 384.90, 384.27
Nearest pivot: 385.22
Above 385.41 → 385.59 next
Lose 385.22 → 384.90 next
BTC (Bitcoin)
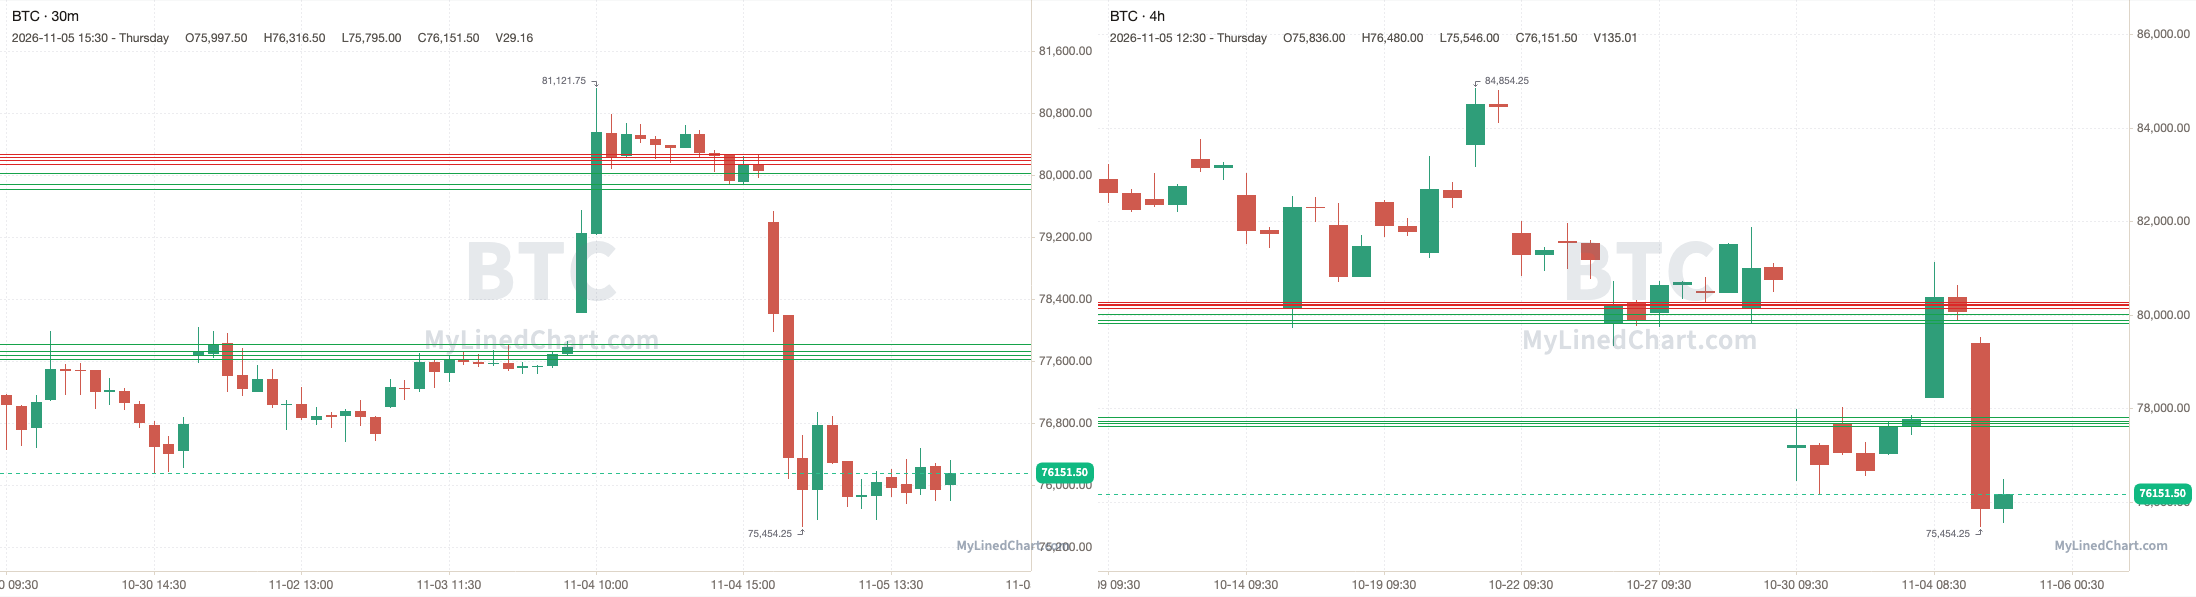
BTC opened at 79390.50, stayed under the 80023.75 pivot and dropped to tag 77622.75, with a low of 75454.25, then ended up closing at 76151.50. Finishing the trading session down 4.08% intraday and down 4.87% overall.
November 5th session levels:
All listed levels: 77622.75, 77675.50, 77720.25, 77818.50, 79817.75, 79886.25, 80023.75, 80138.25, 80197, 80233, 80273.75
Resistance above: 80138.25, 80197, 80233, 80273.75
Support below: 80023.75, 79886.25, 79817.75, 77818.50, 77720.25, 77675.50, 77622.75
Nearest pivot: 80023.75
Above 80138.25 → 80197 next
Lose 80023.75 → 79886.25 next
ETH (Ethereum)
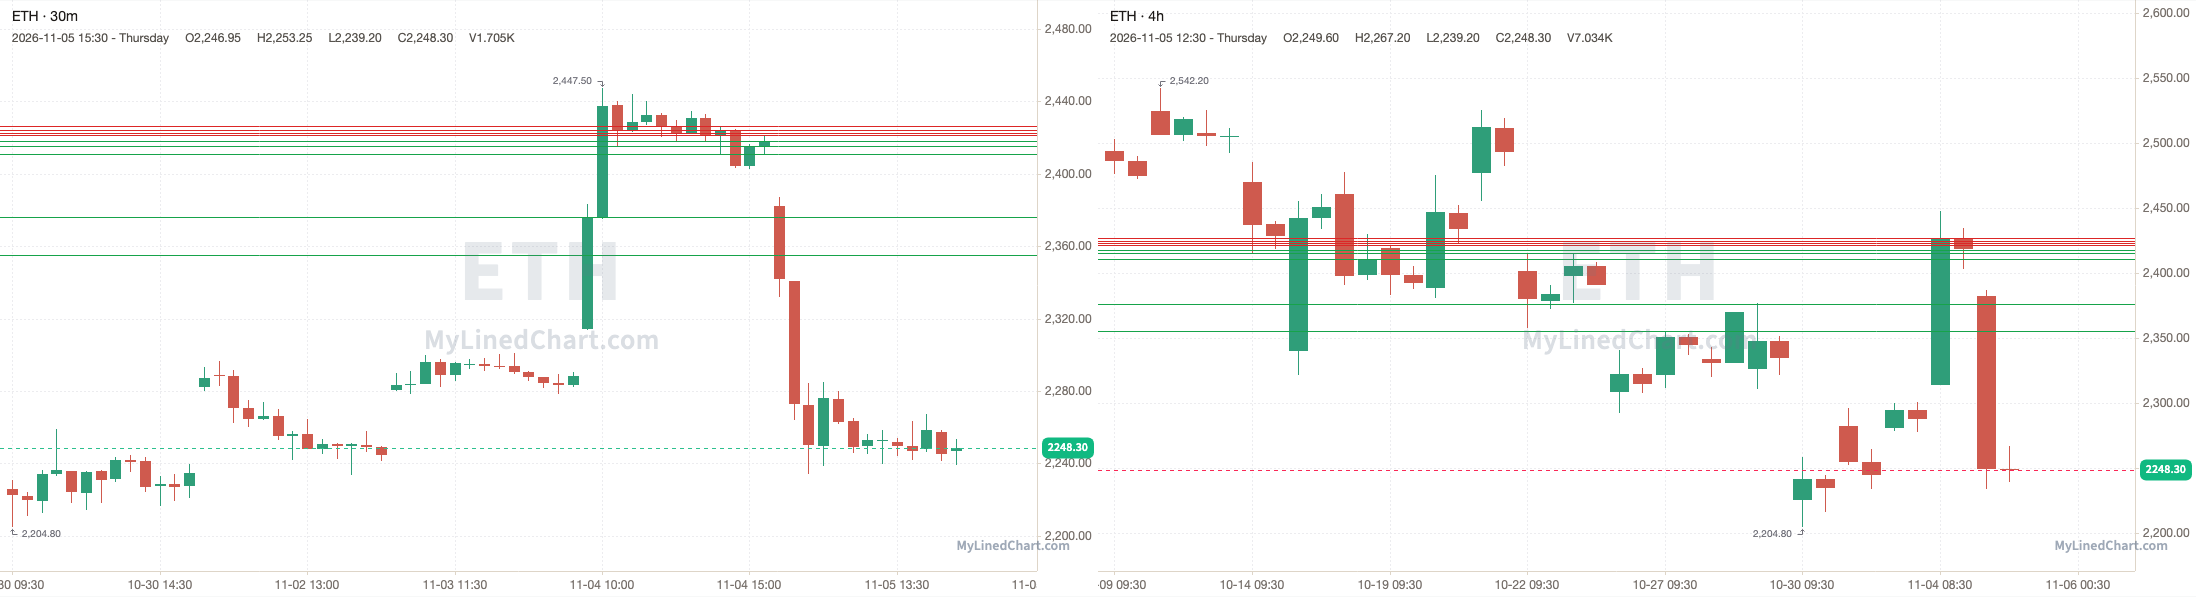
ETH opened at 2382.05, stayed under the 2418 pivot and dropped to tag 2355.20, with a low of 2234.35, then ended up closing at 2248.30. Finishing the trading session down 5.61% intraday and down 7.03% overall.
November 5th session levels:
All listed levels: 2355.20, 2376.30, 2410.75, 2415.25, 2418, 2421.20, 2422.80, 2424.30, 2426.55
Resistance above: 2421.20, 2422.80, 2424.30, 2426.55
Support below: 2418, 2415.25, 2410.75, 2376.30, 2355.20
Nearest pivot: 2418
Above 2421.20 → 2422.80 next
Lose 2418 → 2415.25 next
GLD (SPDR Gold Shares)
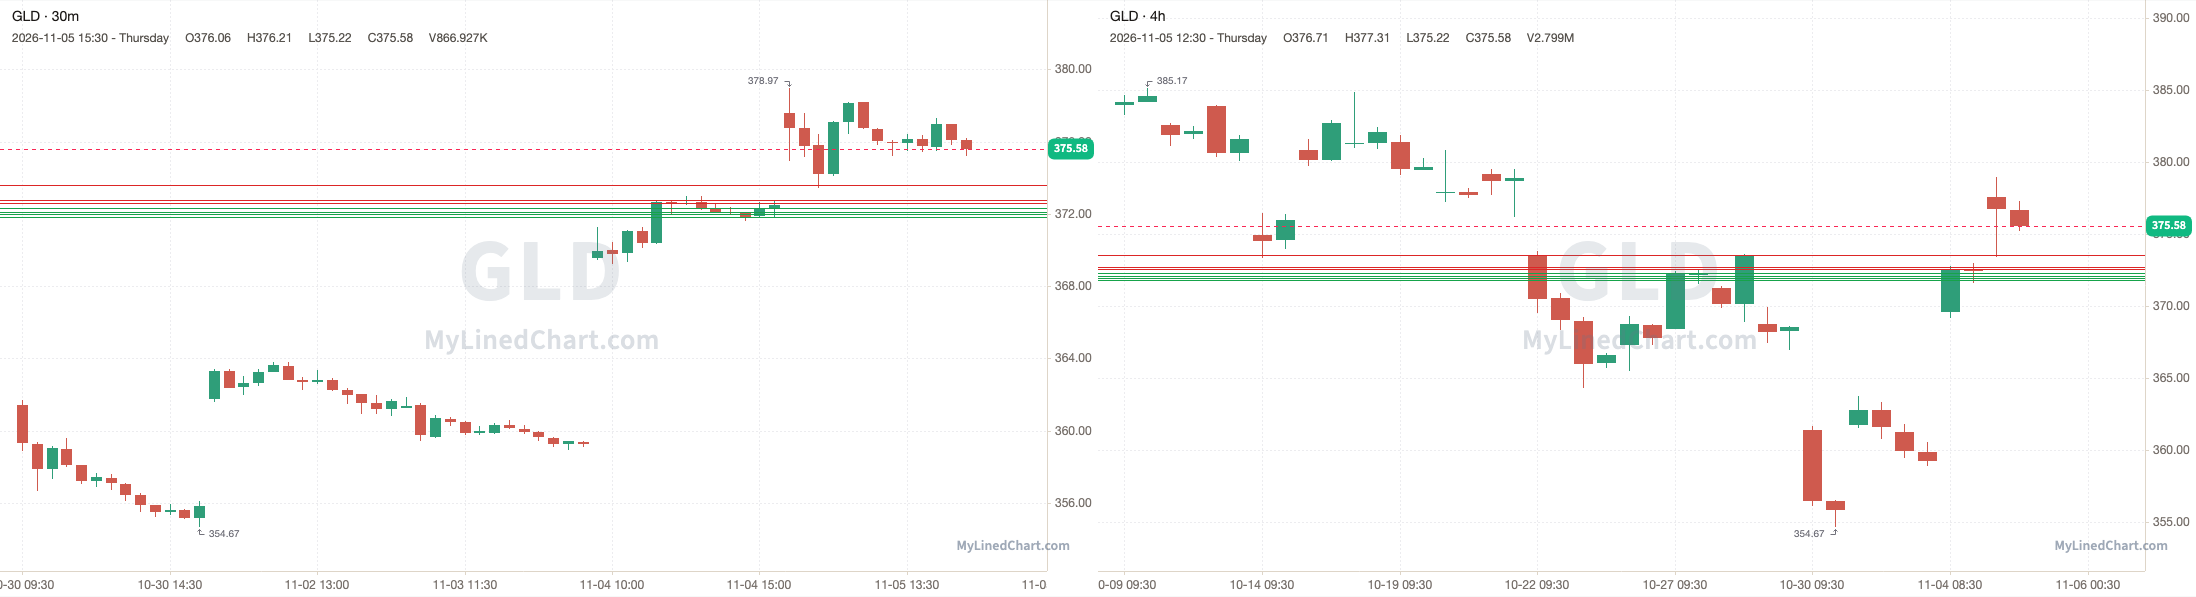
GLD opened at 377.60, held above the 372.62 pivot and dropped to a low of 373.42, then ended up closing at 375.58. Finishing the trading session down 0.53% intraday and up 0.83% overall.
November 5th session levels:
All listed levels: 371.84, 372, 372.11, 372.31, 372.62, 372.76, 373.57
Resistance above: 372.62, 372.76, 373.57
Support below: 372.31, 372.11, 372, 371.84
Nearest pivot: 372.62
Above 372.62 → 372.76 next
Lose 372.31 → 372.11 next
SLV (iShares Silver Trust)
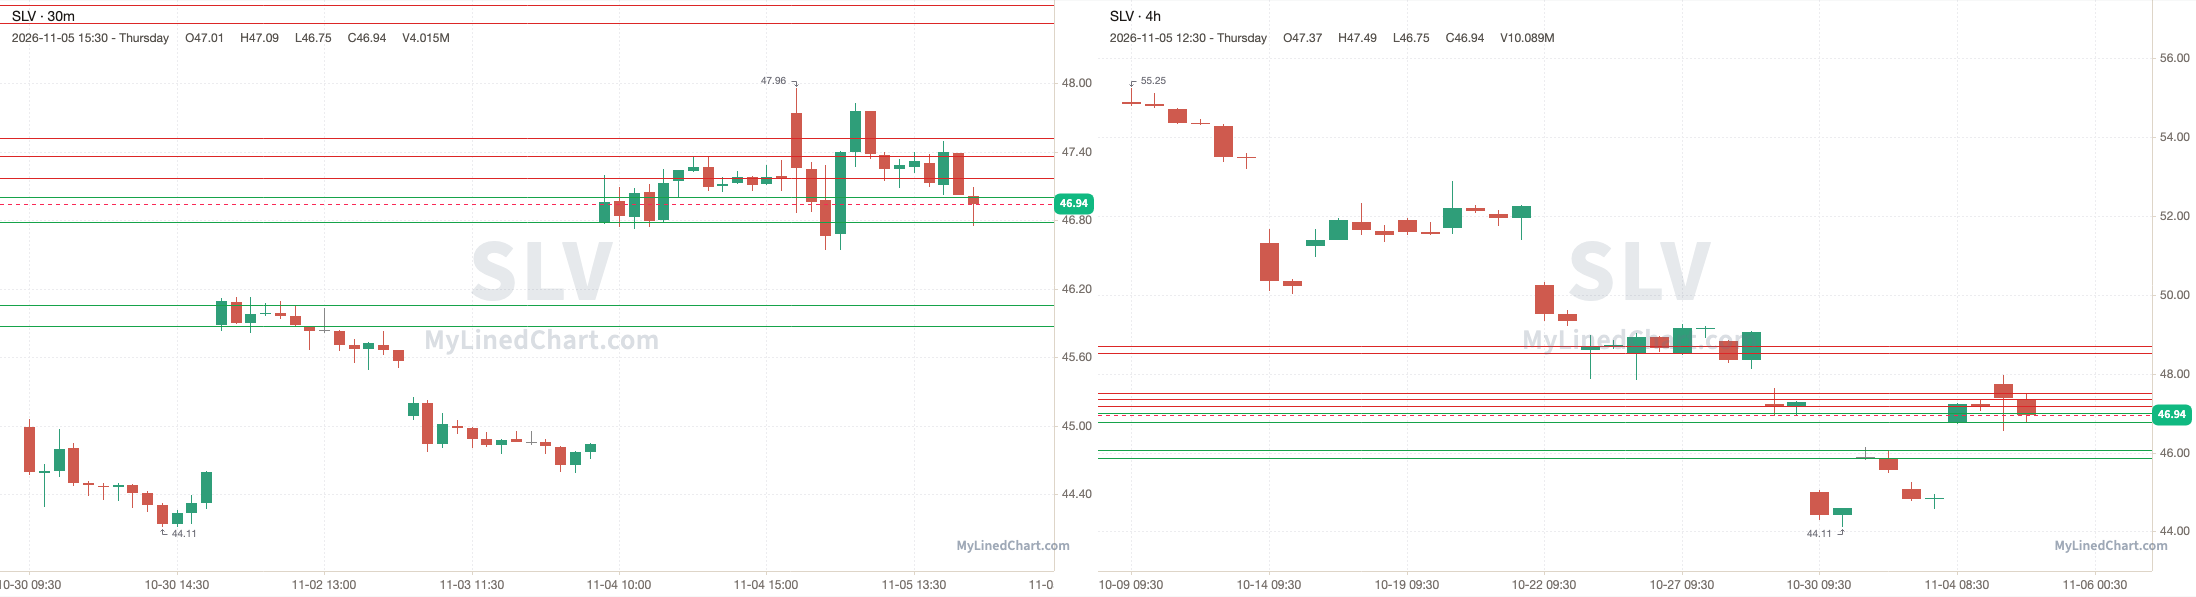
SLV opened at 47.74, broke below the 47.17 pivot and dropped to tag 46.78, with a low of 46.54, then ended up closing at 46.94. Finishing the trading session down 1.68% intraday and down 0.47% overall.
November 5th session levels:
All listed levels: 45.87, 46.06, 46.78, 47, 47.17, 47.36, 47.52, 48.53, 48.69
Resistance above: 47.17, 47.36, 47.52, 48.53, 48.69
Support below: 47, 46.78, 46.06, 45.87
Nearest pivot: 47.17
Above 47.17 → 47.36 next
Lose 47 → 46.78 next
CL (Crude Oil futures)
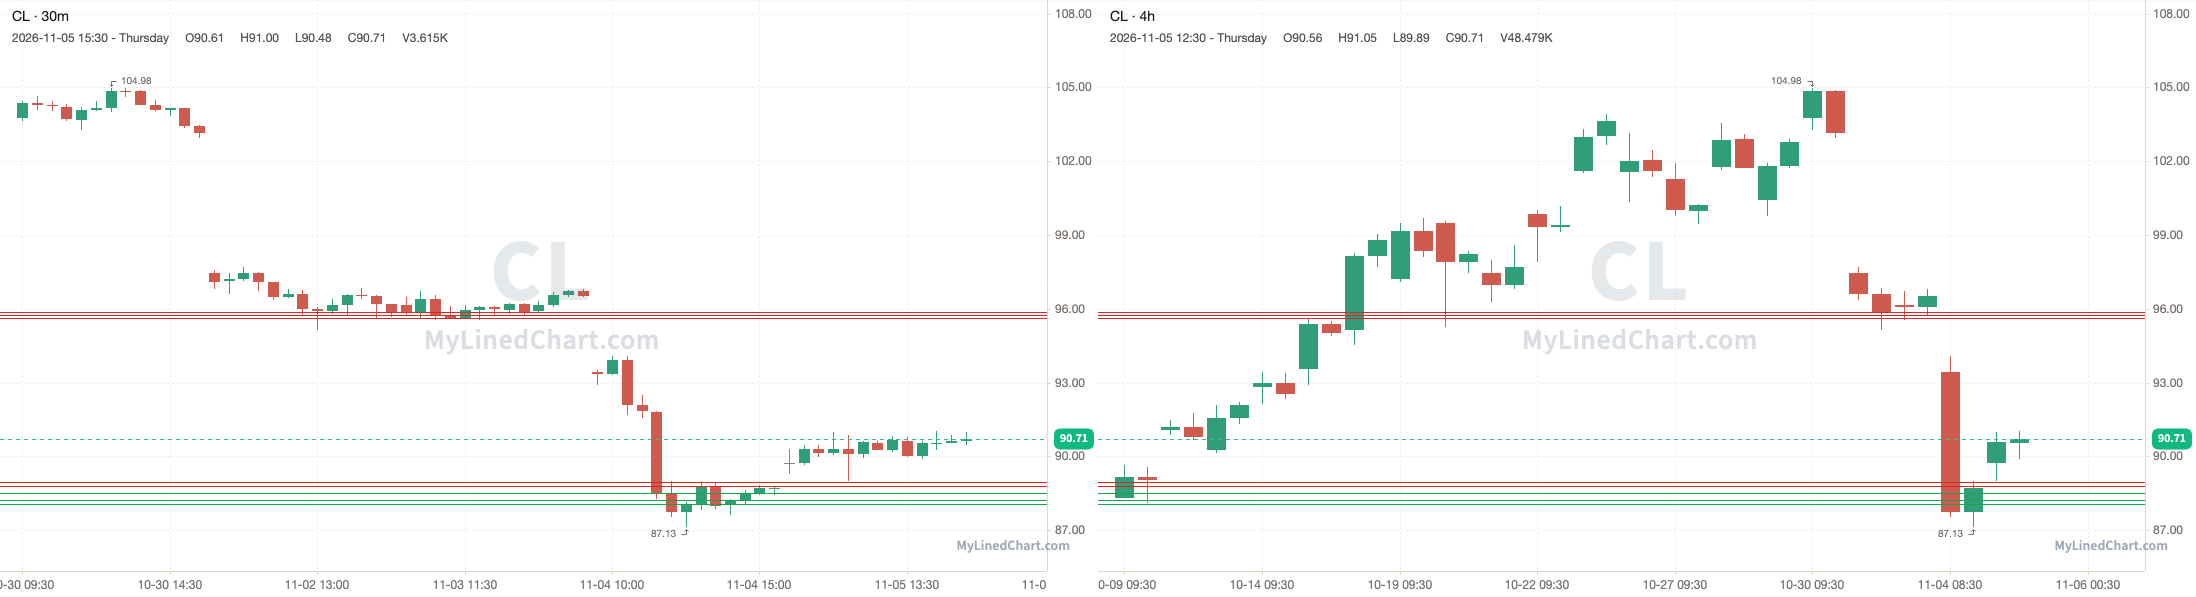
CL opened at 89.73, between the levels without reaching any, with a high of 91.05 and a low of 89, then ended up closing at 90.71. Finishing the trading session up 1.09% intraday.
November 5th session levels:
All listed levels: 88.07, 88.25, 88.52, 88.81, 88.98, 95.63, 95.73, 95.88
Resistance above: 88.81, 88.98, 95.63, 95.73, 95.88
Support below: 88.52, 88.25, 88.07
Nearest pivot: 88.81
Above 88.81 → 88.98 next
Lose 88.52 → 88.25 next
GC (Gold futures)
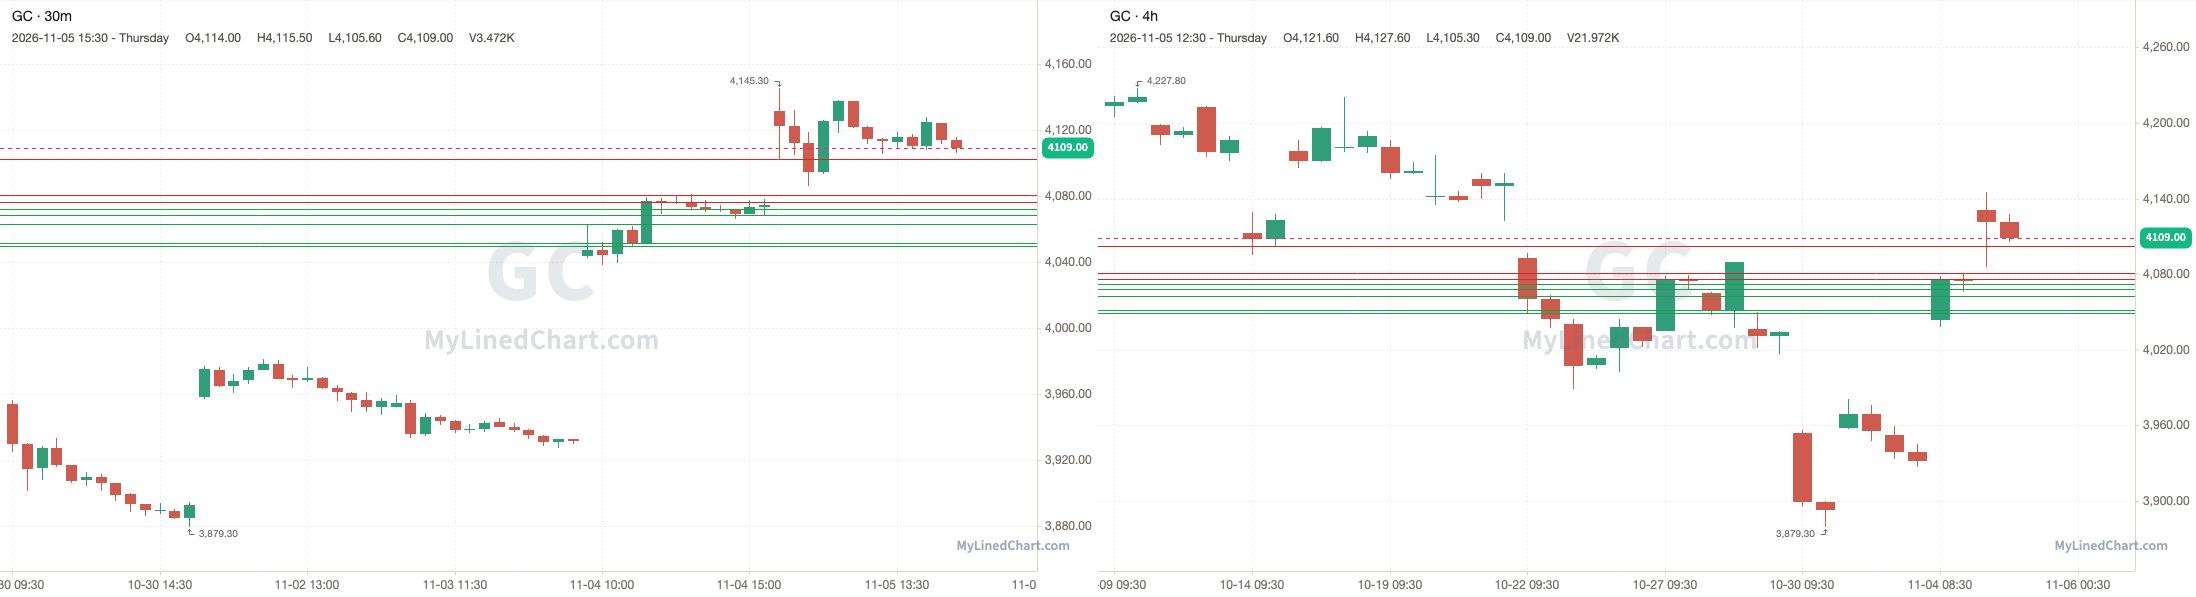
GC opened at 4131.20, held above the 4072.10 pivot and dropped to a low of 4085.60, then ended up closing at 4109. Finishing the trading session down 0.54% intraday.
November 5th session levels:
All listed levels: 4049.30, 4051.50, 4062.90, 4068, 4072.10, 4076.30, 4080.50, 4102
Resistance above: 4076.30, 4080.50, 4102
Support below: 4072.10, 4068, 4062.90, 4051.50, 4049.30
Nearest pivot: 4072.10
Above 4076.30 → 4080.50 next
Lose 4072.10 → 4068 next
AMD (Advanced Micro Devices)
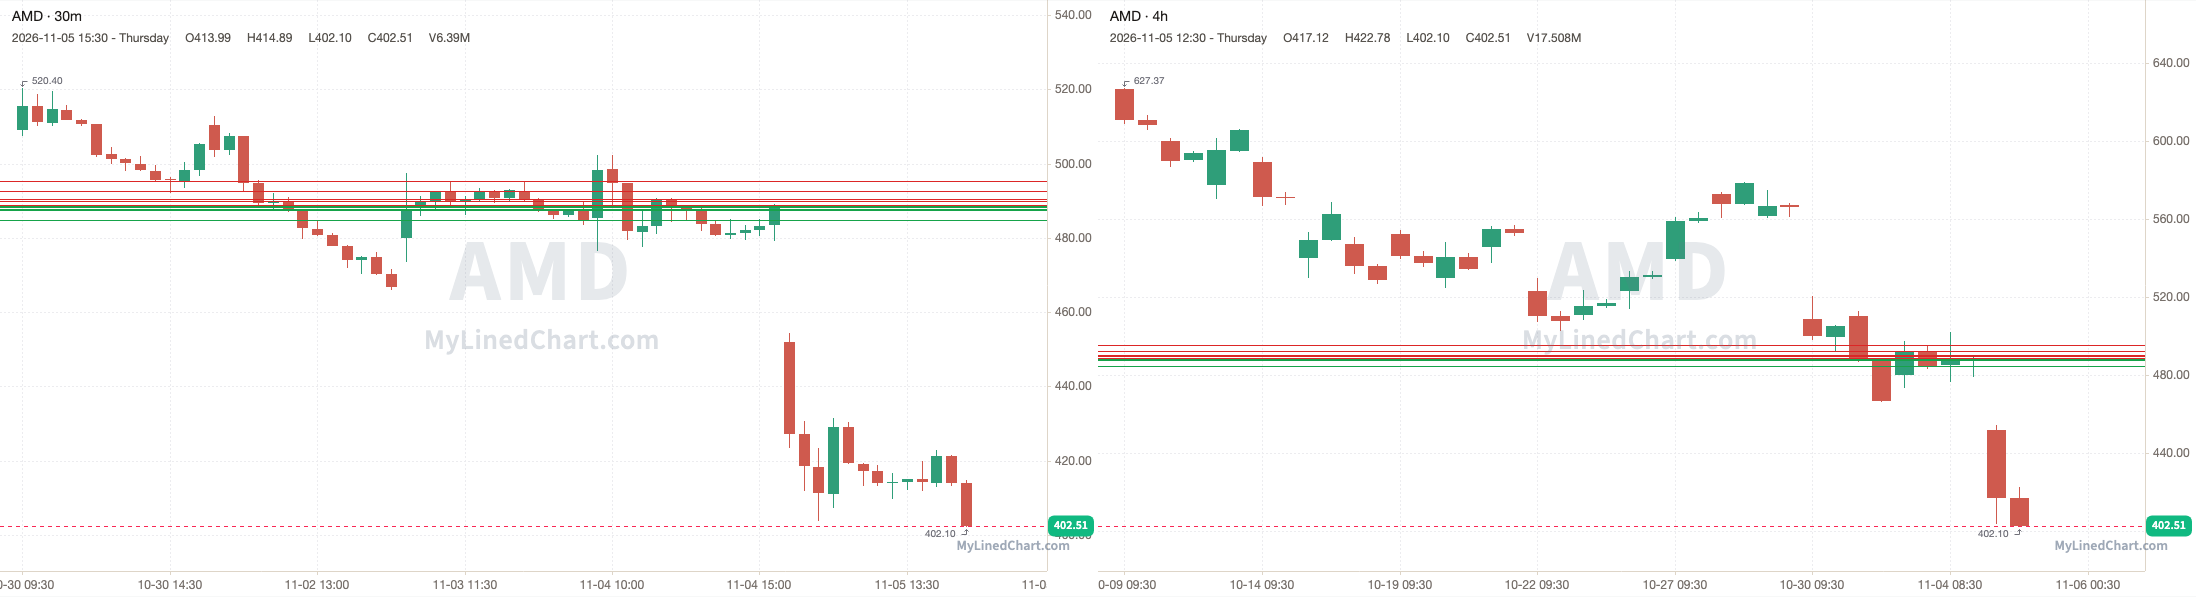
AMD opened at 452.02, under the 488.81 pivot and every level in the plan, and never traded back up to them, with a high of 454.48 and a low of 402.10, then ended up closing at 402.51. Finishing the trading session down 10.95% intraday and down 17.65% overall.
November 5th session levels:
All listed levels: 484.70, 487.59, 487.70, 487.90, 488.36, 488.62, 488.81, 490.02, 490.53, 492.53, 495.28
Resistance above: 488.81, 490.02, 490.53, 492.53, 495.28
Support below: 488.62, 488.36, 487.90, 487.70, 487.59, 484.70
Nearest pivot: 488.81
Above 488.81 → 490.02 next
Lose 488.62 → 488.36 next
MSTR (Strategy)
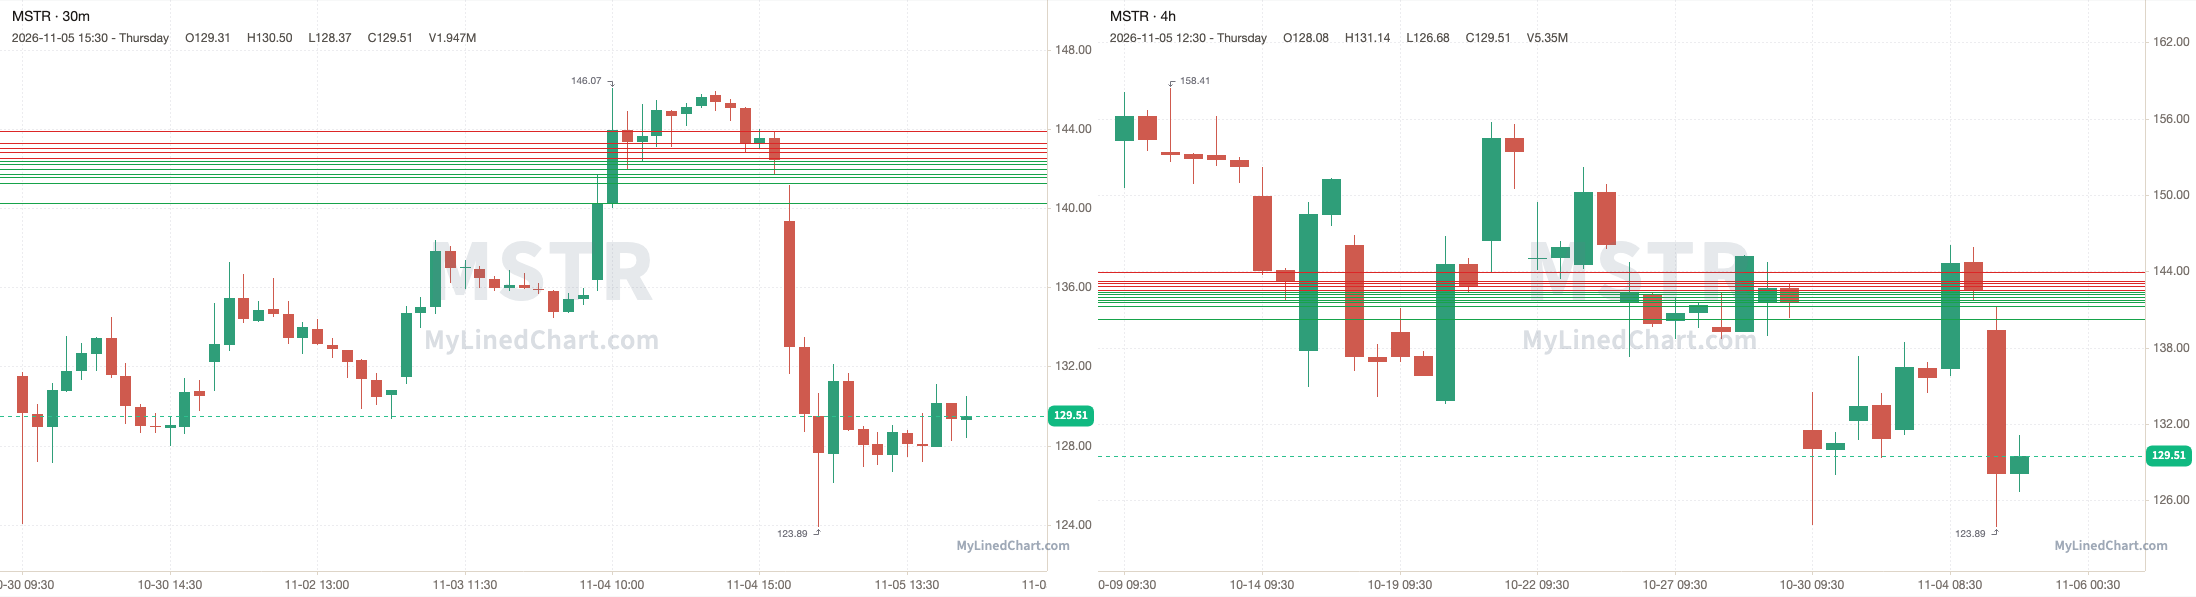
MSTR opened at 139.37, stayed under the 142.37 pivot and dropped to a low of 123.89, then ended up closing at 129.51. Finishing the trading session down 7.07% intraday and down 9.07% overall.
November 5th session levels:
All listed levels: 140.27, 141.24, 141.56, 141.70, 141.98, 142.23, 142.37, 142.53, 142.83, 143.05, 143.26, 143.91
Resistance above: 142.53, 142.83, 143.05, 143.26, 143.91
Support below: 142.37, 142.23, 141.98, 141.70, 141.56, 141.24, 140.27
Nearest pivot: 142.37
Above 142.53 → 142.83 next
Lose 142.37 → 142.23 next
AAPL (Apple)
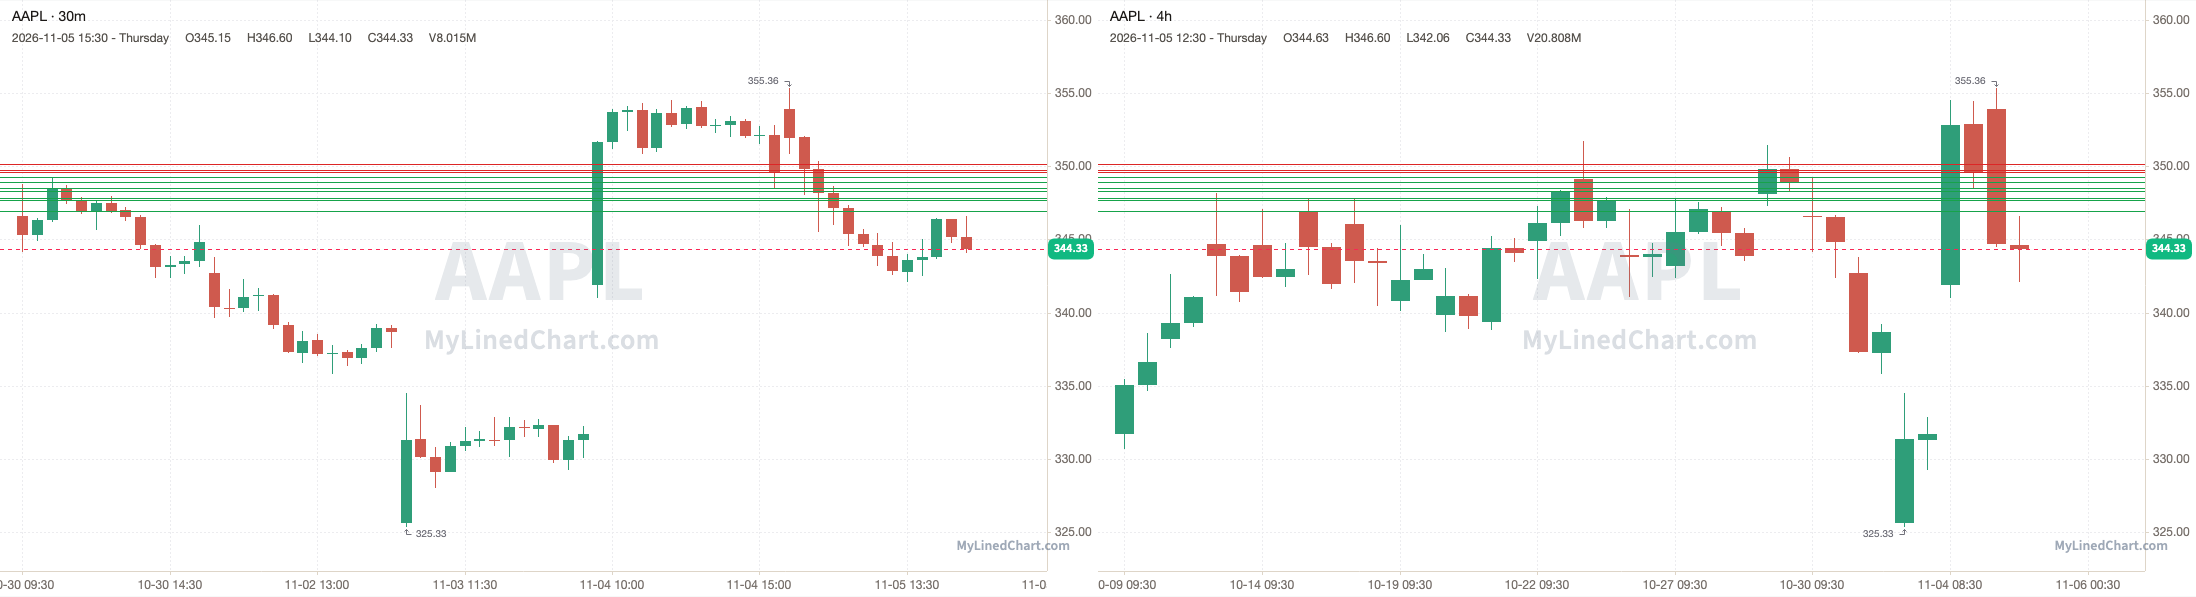
AAPL opened at 353.89, broke below the 349.61 pivot and ran through every support level down to 346.95, and kept going to a low of 342.06, then ended up closing at 344.33. Finishing the trading session down 2.70% intraday and down 1.51% overall.
November 5th session levels:
All listed levels: 346.95, 347.70, 347.85, 348.34, 348.50, 348.93, 349.26, 349.61, 349.77, 350.13
Resistance above: 349.61, 349.77, 350.13
Support below: 349.26, 348.93, 348.50, 348.34, 347.85, 347.70, 346.95
Nearest pivot: 349.61
Above 349.61 → 349.77 next
Lose 349.26 → 348.93 next
PLTR (Palantir)
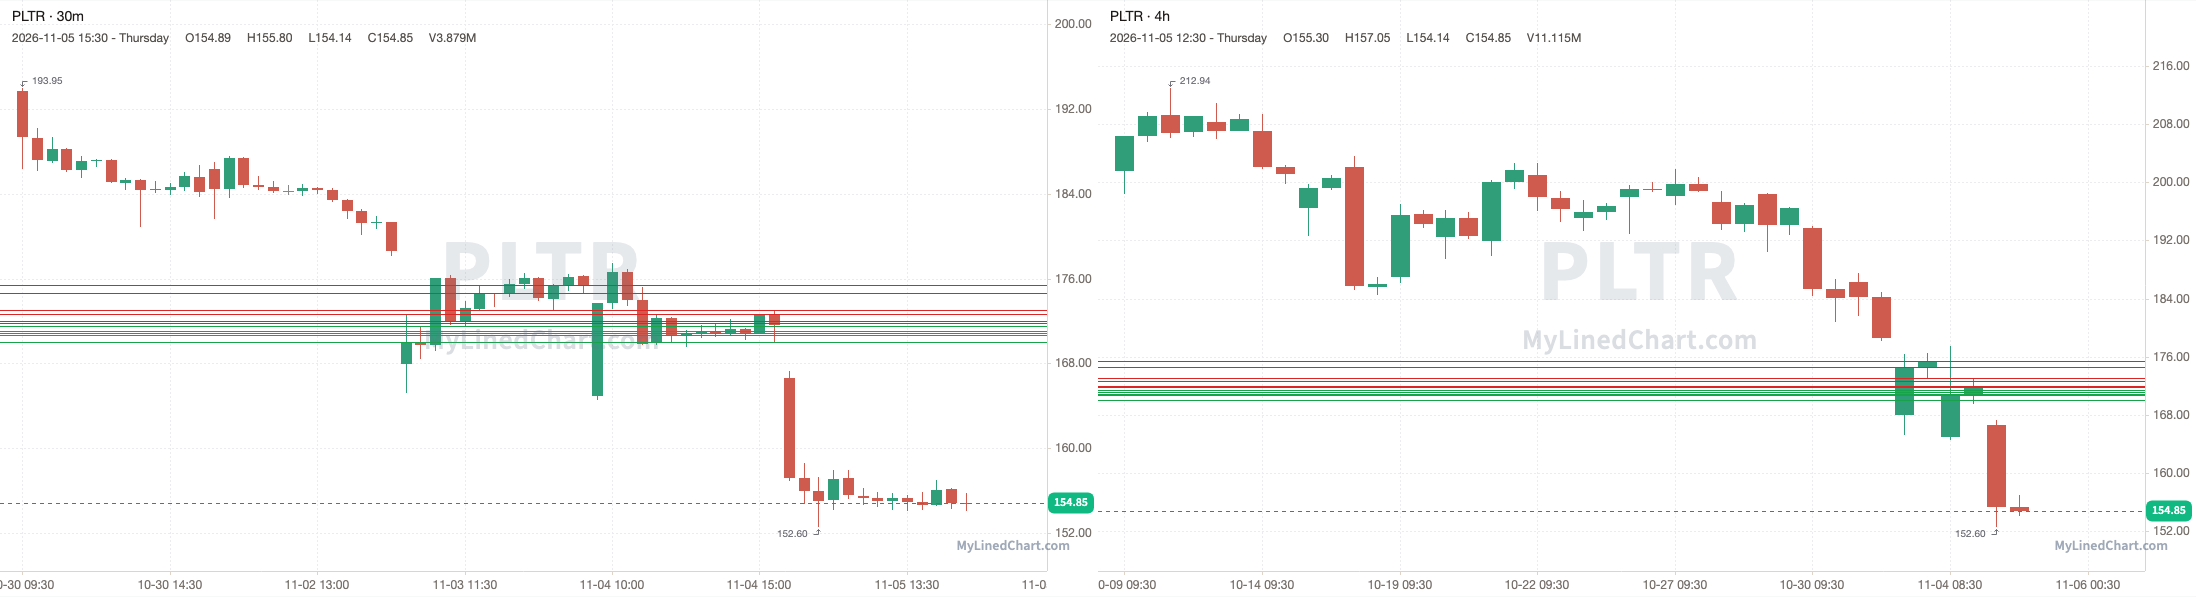
PLTR opened at 166.65, under the 171.80 pivot and every level in the plan, and never traded back up to them, with a high of 167.25 and a low of 152.60, then ended up closing at 154.85. Finishing the trading session down 7.08% intraday and down 9.79% overall.
November 5th session levels:
All listed levels: 170, 170.72, 170.88, 171.10, 171.49, 171.80, 171.98, 172.64, 173.08, 174.61, 175.43
Resistance above: 171.80, 171.98, 172.64, 173.08, 174.61, 175.43
Support below: 171.49, 171.10, 170.88, 170.72, 170
Nearest pivot: 171.80
Above 171.80 → 171.98 next
Lose 171.49 → 171.10 next
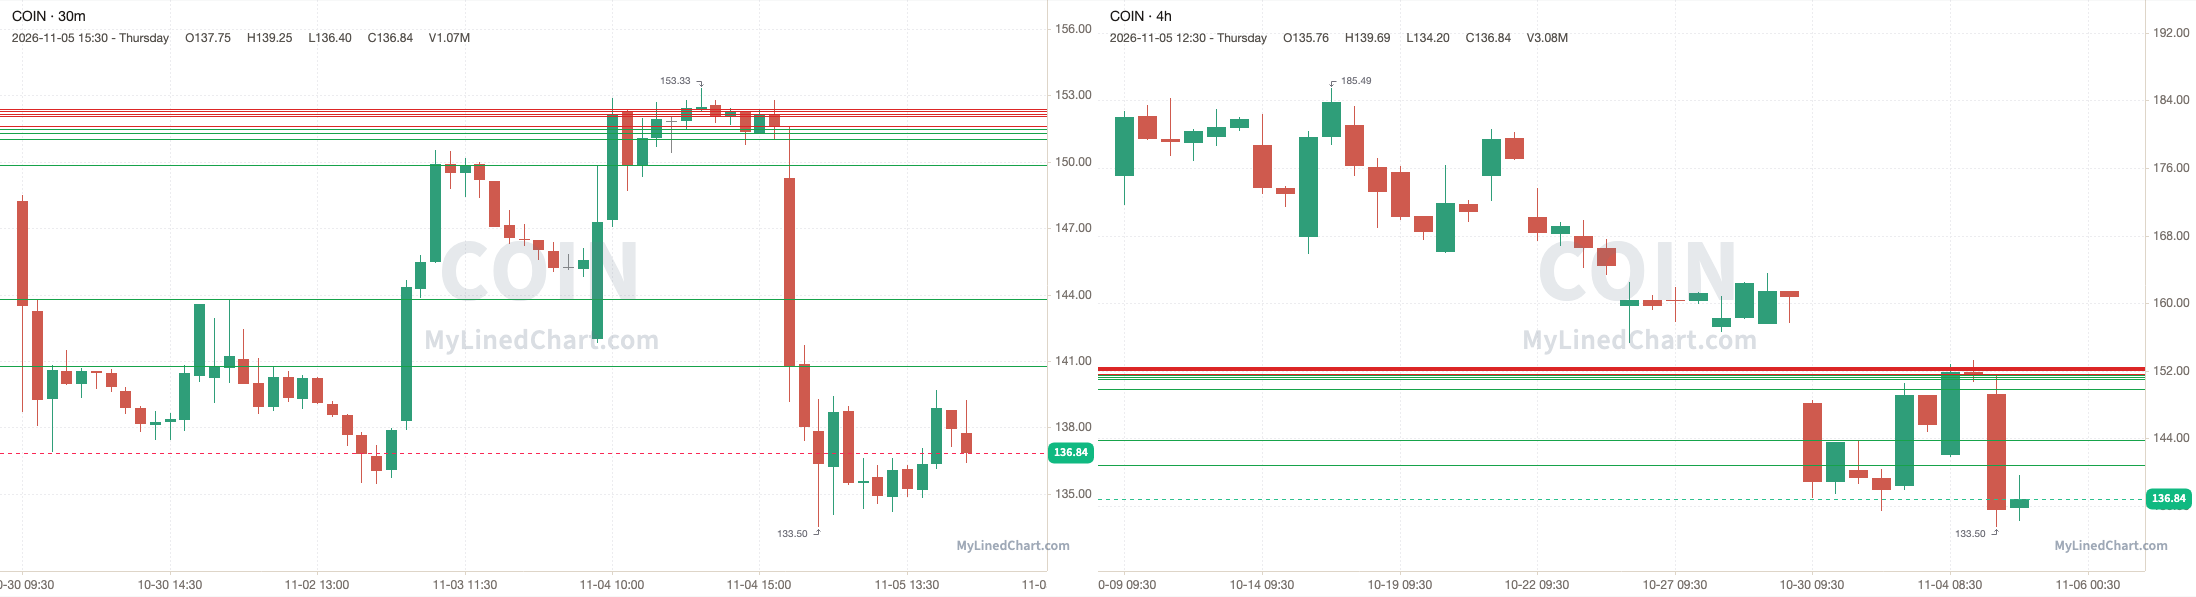
COIN (Coinbase)
COIN opened at 149.24, stayed under the 151.63 pivot and dropped to tag 140.79, with a low of 133.50, then ended up closing at 136.84. Finishing the trading session down 8.31% intraday and down 9.72% overall.
November 5th session levels:
All listed levels: 140.79, 143.79, 149.85, 151.04, 151.28, 151.46, 151.63, 152.05, 152.17, 152.28, 152.39
Resistance above: 151.63, 152.05, 152.17, 152.28, 152.39
Support below: 151.46, 151.28, 151.04, 149.85, 143.79, 140.79
Nearest pivot: 151.63
Above 151.63 → 152.05 next
Lose 151.46 → 151.28 next
AMZN (Amazon)
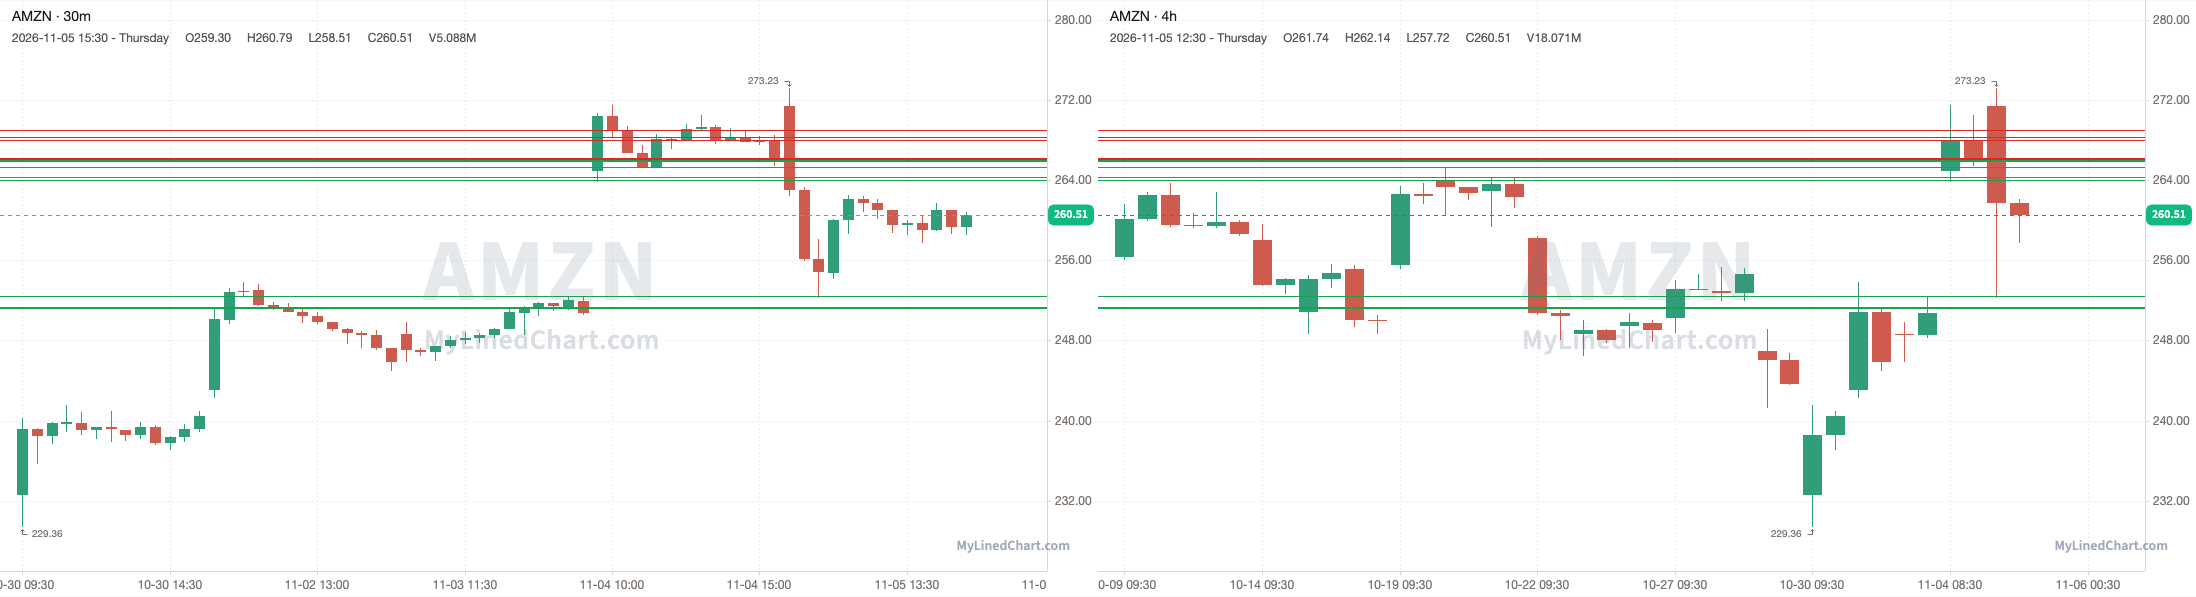
AMZN opened at 271.43, broke below the 266.15 pivot and dropped to tag 252.45, with a low of 252.27, then ended up closing at 260.51. Finishing the trading session down 4.02% intraday and down 2.11% overall.
November 5th session levels:
All listed levels: 251.26, 251.39, 252.45, 264.07, 264.34, 265.37, 265.91, 266.01, 266.15, 266.24, 268.03, 268.30, 269.06
Resistance above: 266.15, 266.24, 268.03, 268.30, 269.06
Support below: 266.01, 265.91, 265.37, 264.34, 264.07, 252.45, 251.39, 251.26
Nearest pivot: 266.15
Above 266.15 → 266.24 next
Lose 266.01 → 265.91 next
META (Meta Platforms)
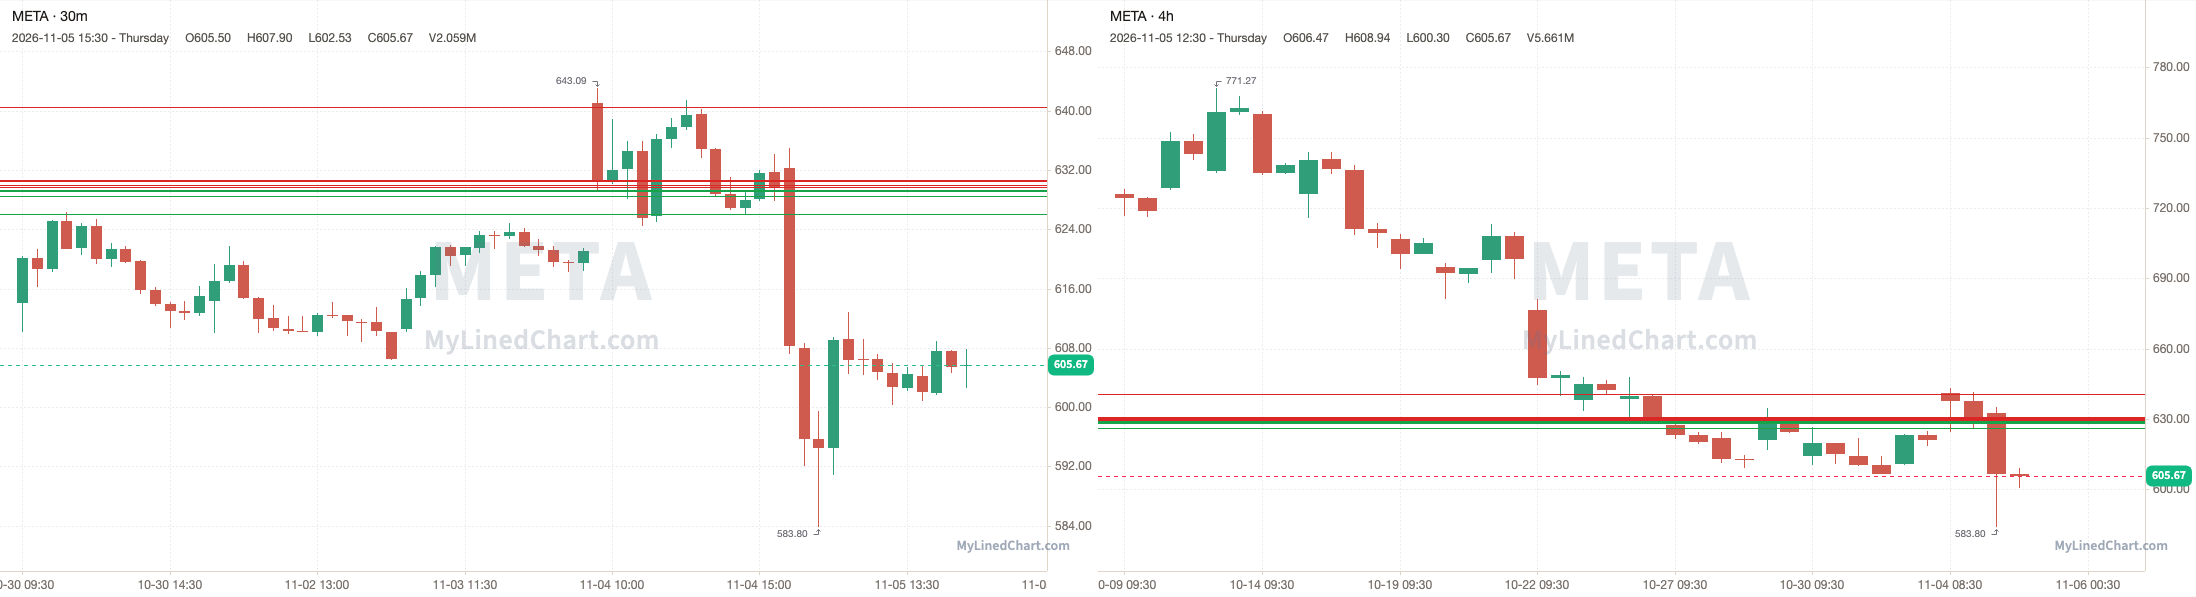
META opened at 632.30, broke below the 629.67 pivot and ran through every support level down to 626.02, and kept going to a low of 583.80, then ended up closing at 605.67. Finishing the trading session down 4.21% intraday and down 3.81% overall.
November 5th session levels:
All listed levels: 626.02, 628.43, 628.54, 629.14, 629.35, 629.67, 629.92, 630.47, 630.66, 640.48
Resistance above: 629.67, 629.92, 630.47, 630.66, 640.48
Support below: 629.35, 629.14, 628.54, 628.43, 626.02
Nearest pivot: 629.67
Above 629.67 → 629.92 next
Lose 629.35 → 629.14 next
MSFT (Microsoft)
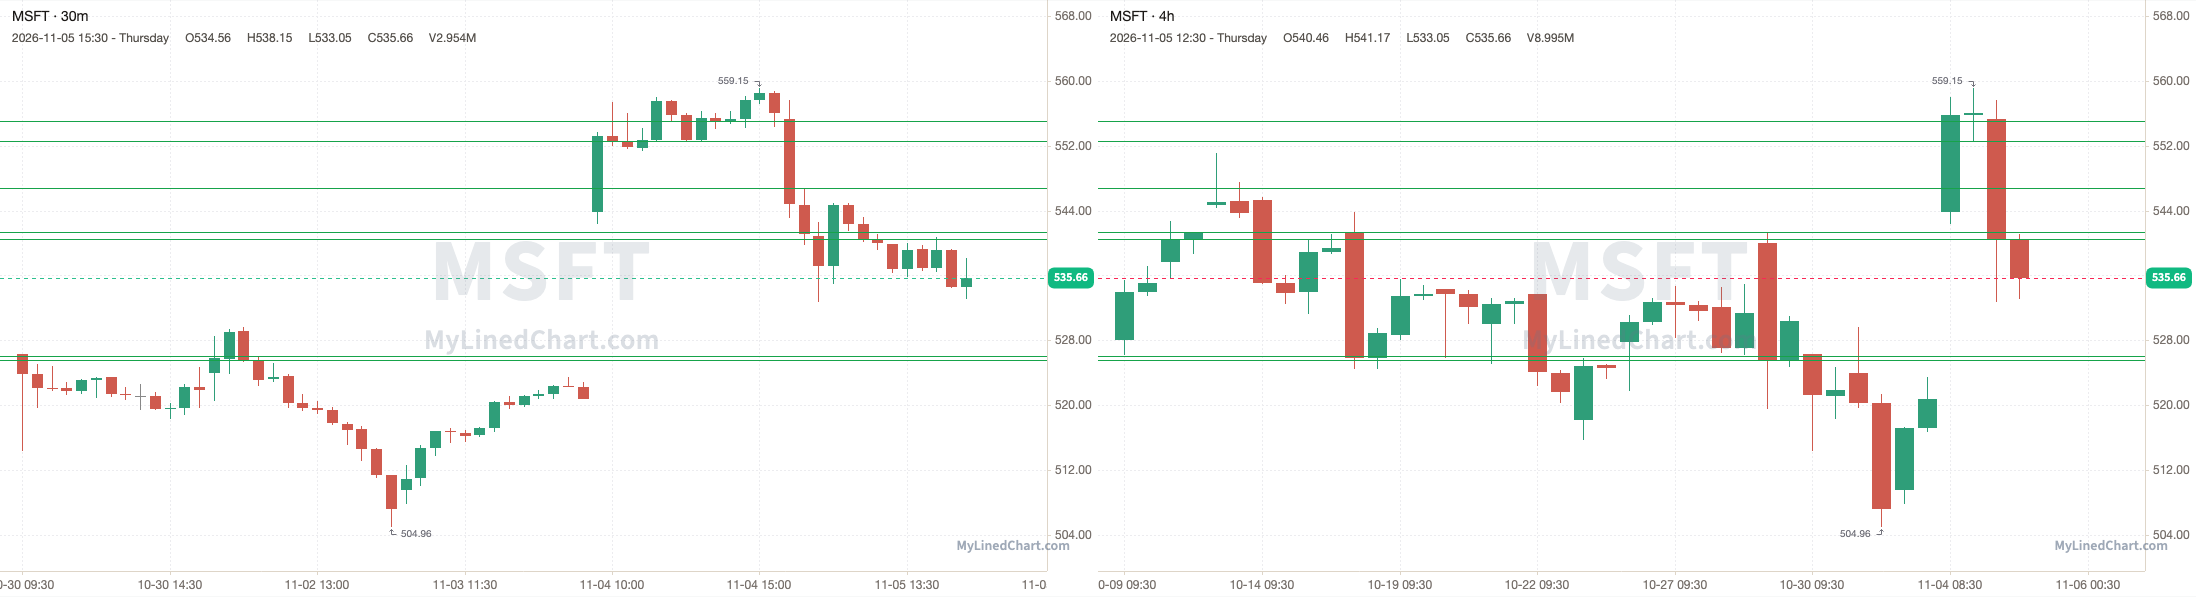
MSFT opened at 555.29, broke below the 555.01 pivot and dropped to tag 540.54, with a low of 532.67, then ended up closing at 535.66. Finishing the trading session down 3.54% intraday and down 3.66% overall.
November 5th session levels:
All listed levels: 525.55, 526.08, 540.54, 541.31, 546.85, 552.65, 555.01
Resistance above: none
Support below: 555.01, 552.65, 546.85, 541.31, 540.54, 526.08, 525.55
Nearest pivot: 555.01
Lose 555.01 → 552.65 next
SMCI (Super Micro Computer)
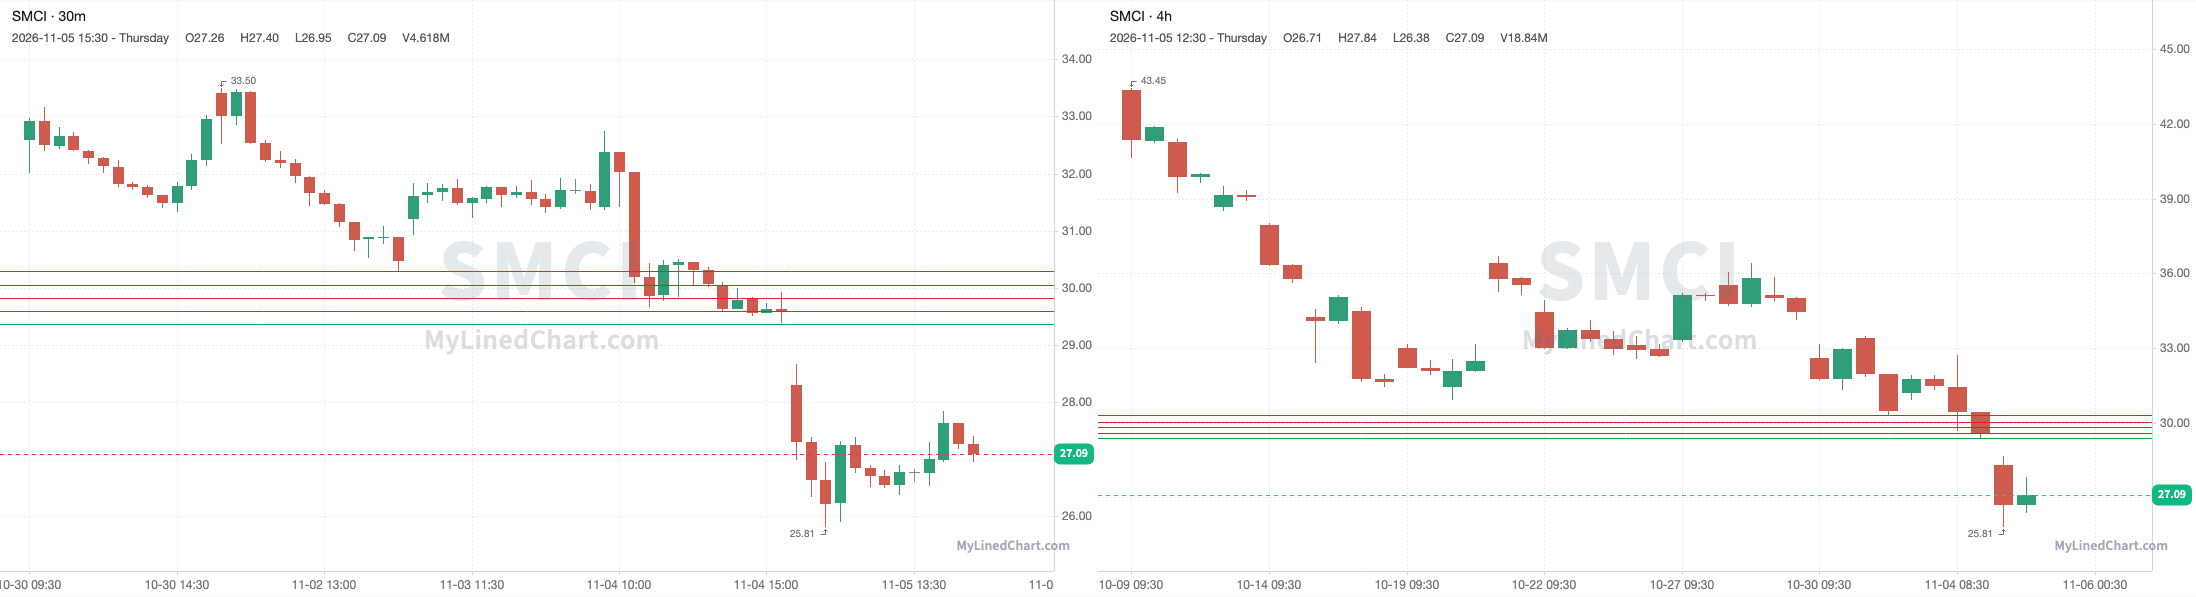
SMCI opened at 28.30, under the 29.60 pivot and every level in the plan, and never traded back up to them, with a high of 28.67 and a low of 25.81, then ended up closing at 27.09. Finishing the trading session down 4.28% intraday and down 8.48% overall.
November 5th session levels:
All listed levels: 29.37, 29.60, 29.82, 30.05, 30.30
Resistance above: 29.82, 30.05, 30.30
Support below: 29.37
Nearest pivot: 29.60
Above 29.82 → 30.05 next
Lose 29.37 → open air
HOOD (Robinhood)
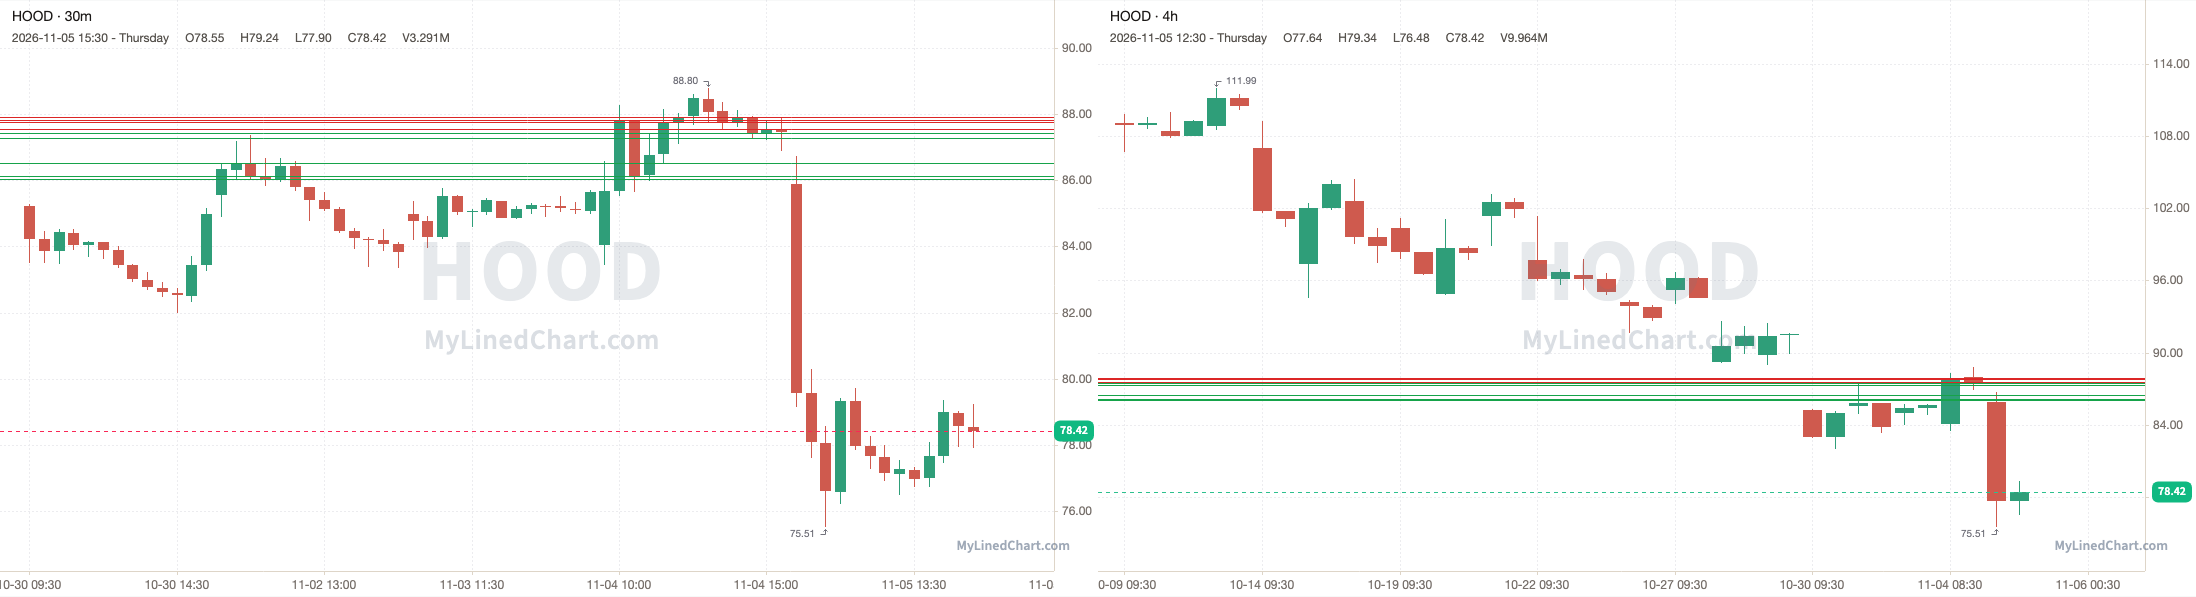
HOOD opened at 85.88, stayed under the 87.44 pivot and dropped to a low of 75.51, then ended up closing at 78.42. Finishing the trading session down 8.69% intraday and down 10.34% overall.
November 5th session levels:
All listed levels: 86.05, 86.14, 86.52, 87.27, 87.44, 87.54, 87.77, 87.82, 87.92
Resistance above: 87.54, 87.77, 87.82, 87.92
Support below: 87.44, 87.27, 86.52, 86.14, 86.05
Nearest pivot: 87.44
Above 87.54 → 87.77 next
Lose 87.44 → 87.27 next
MARA (MARA Holdings)
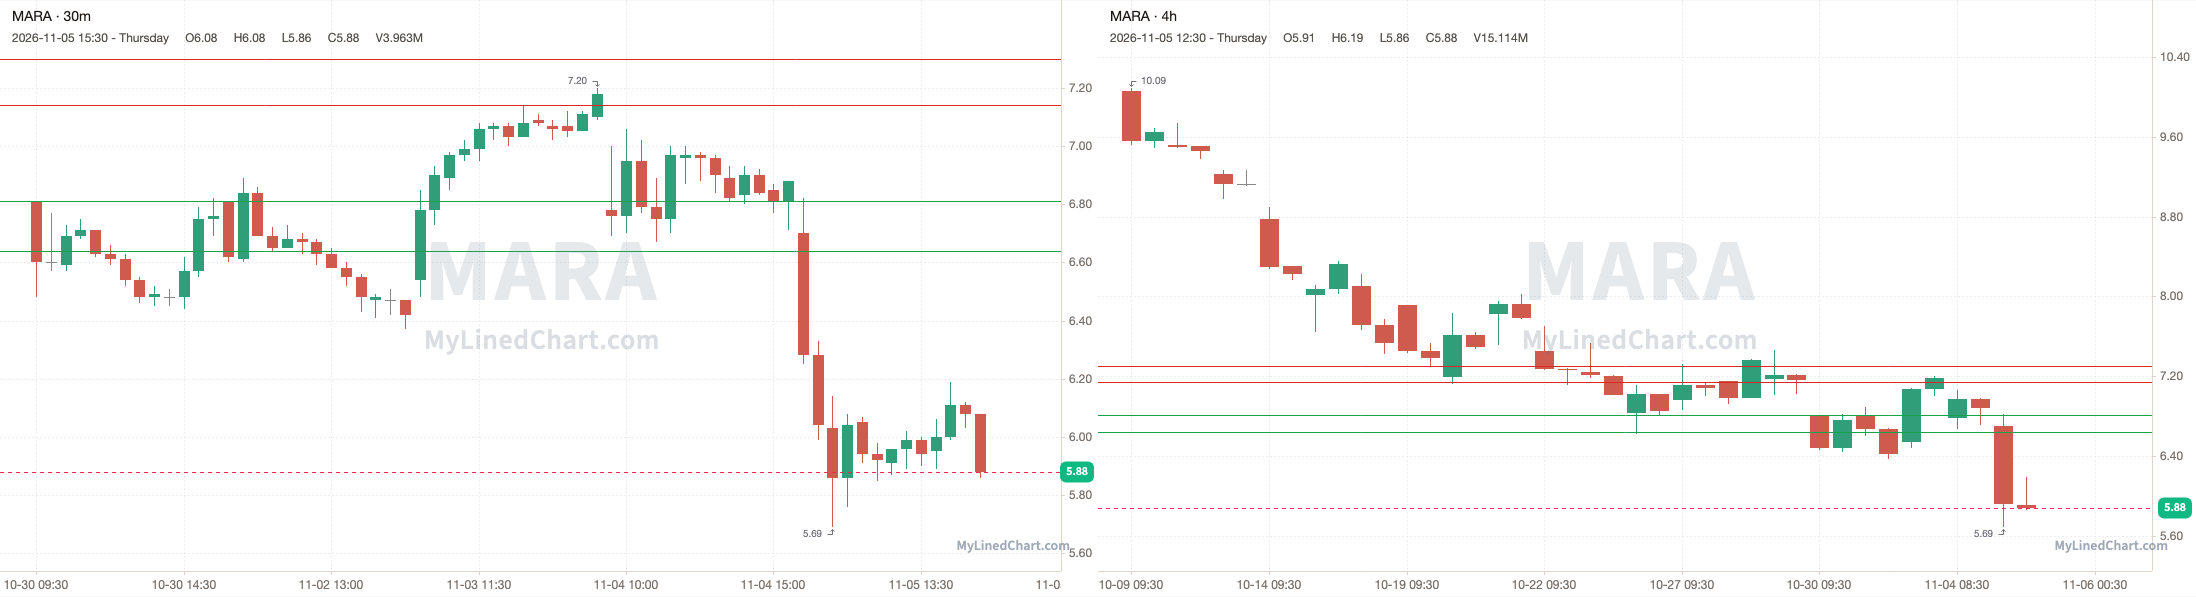
MARA opened at 6.70, popped above the 6.81 pivot to a high of 6.82, then lost it and ran through every support level down to 6.64, and kept going to a low of 5.69, then ended up closing at 5.88. Finishing the trading session down 12.24% intraday and down 14.53% overall.
November 5th session levels:
All listed levels: 6.64, 6.81, 7.14, 7.30
Resistance above: 7.14, 7.30
Support below: 6.81, 6.64
Nearest pivot: 6.81
Above 7.14 → 7.30 next
Lose 6.81 → 6.64 next
GME (GameStop)
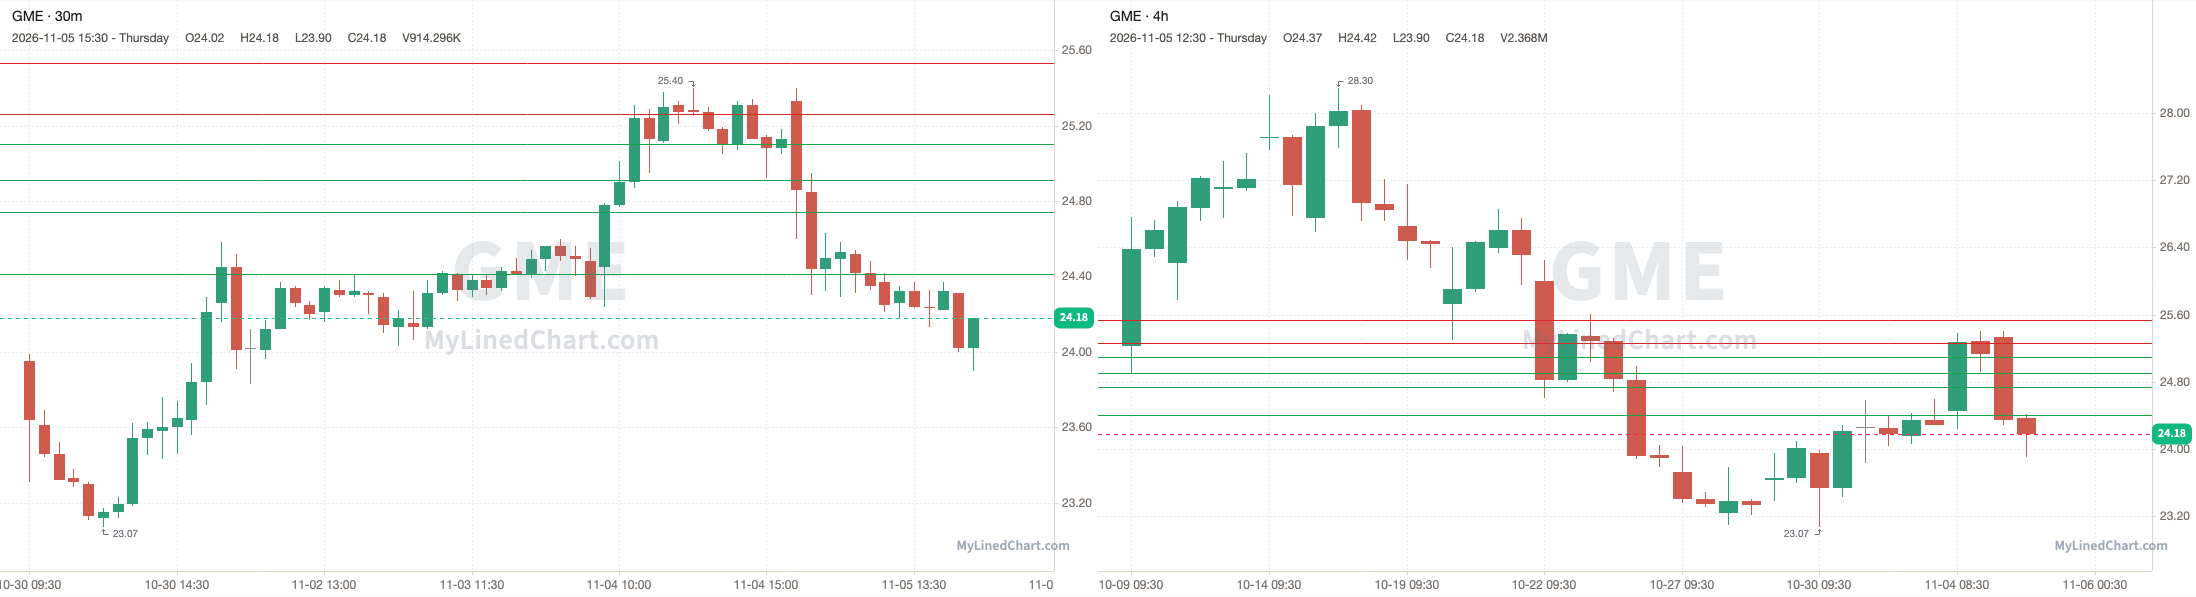
GME opened at 25.33, broke below the 25.10 pivot and ran through every support level down to 24.41, and kept going to a low of 23.90, then ended up closing at 24.18. Finishing the trading session down 4.54% intraday and down 3.78% overall.
November 5th session levels:
All listed levels: 24.41, 24.74, 24.91, 25.10, 25.26, 25.53
Resistance above: 25.26, 25.53
Support below: 25.10, 24.91, 24.74, 24.41
Nearest pivot: 25.10
Above 25.26 → 25.53 next
Lose 25.10 → 24.91 next
IBIT (iShares Bitcoin Trust)
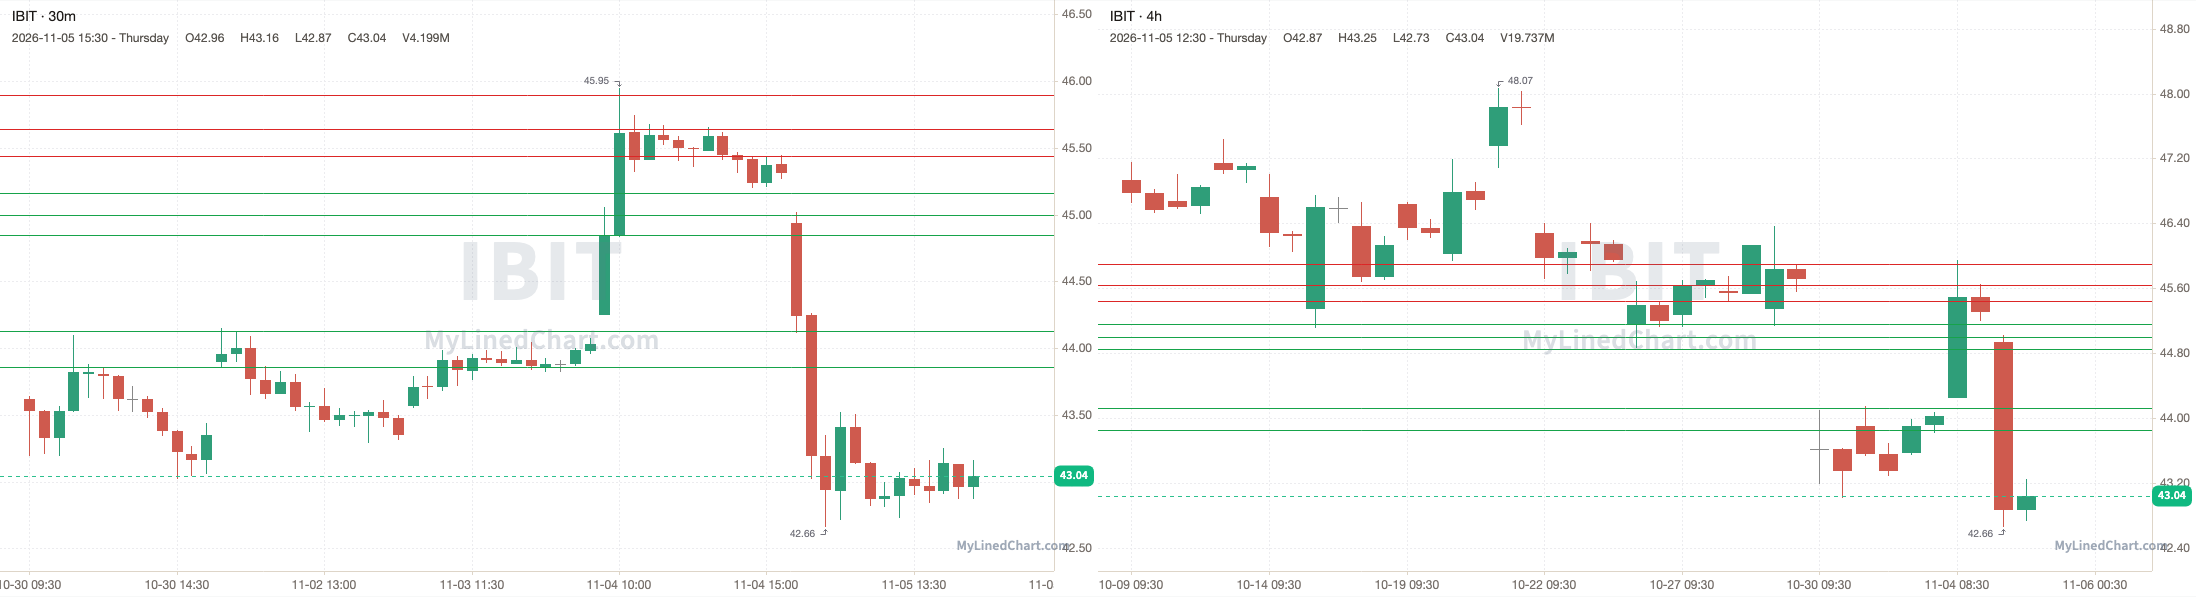
IBIT opened at 44.94, stayed under the 45.44 pivot and dropped to tag 43.86, with a low of 42.66, then ended up closing at 43.04. Finishing the trading session down 4.23% intraday and down 5.01% overall.
November 5th session levels:
All listed levels: 43.86, 44.13, 44.85, 45, 45.16, 45.44, 45.64, 45.90
Resistance above: 45.44, 45.64, 45.90
Support below: 45.16, 45, 44.85, 44.13, 43.86
Nearest pivot: 45.44
Above 45.44 → 45.64 next
Lose 45.16 → 45 next
ETHA (iShares Ethereum Trust)
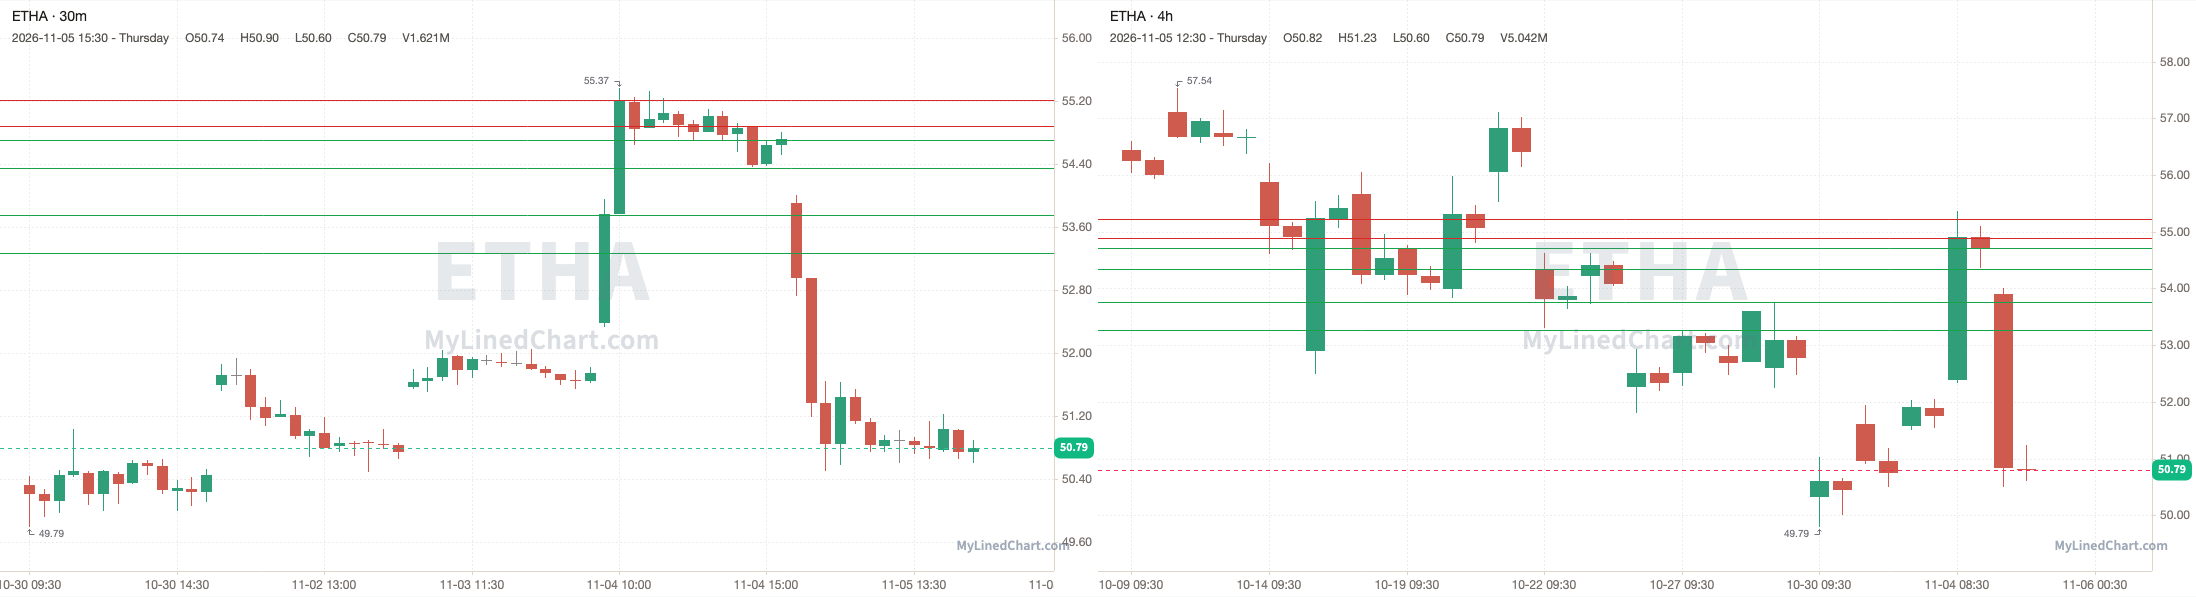
ETHA opened at 53.91, stayed under the 54.71 pivot and dropped to tag 53.27, with a low of 50.50, then ended up closing at 50.79. Finishing the trading session down 5.79% intraday and down 7.18% overall.
November 5th session levels:
All listed levels: 53.27, 53.76, 54.35, 54.71, 54.89, 55.22
Resistance above: 54.89, 55.22
Support below: 54.71, 54.35, 53.76, 53.27
Nearest pivot: 54.71
Above 54.89 → 55.22 next
Lose 54.71 → 54.35 next
INTC (Intel)
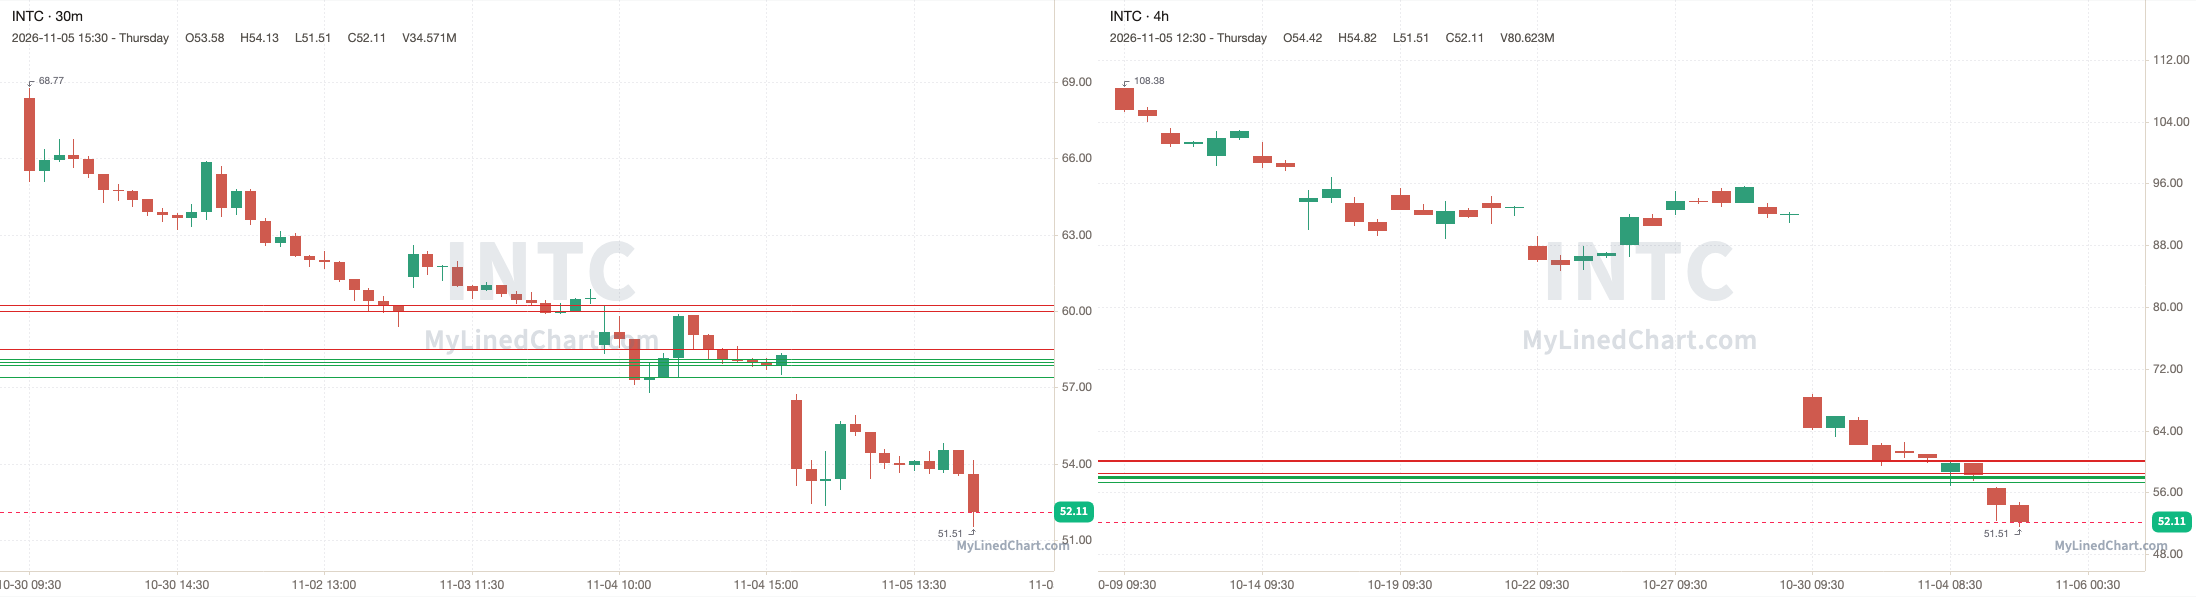
INTC opened at 56.52, under the 58.12 pivot and every level in the plan, and never traded back up to them, with a high of 56.73 and a low of 51.51, then ended up closing at 52.11. Finishing the trading session down 7.80% intraday and down 10.59% overall.
November 5th session levels:
All listed levels: 57.39, 57.88, 57.98, 58.12, 58.52, 60.01, 60.23
Resistance above: 58.52, 60.01, 60.23
Support below: 58.12, 57.98, 57.88, 57.39
Nearest pivot: 58.12
Above 58.52 → 60.01 next
Lose 58.12 → 57.98 next
RIVN (Rivian)
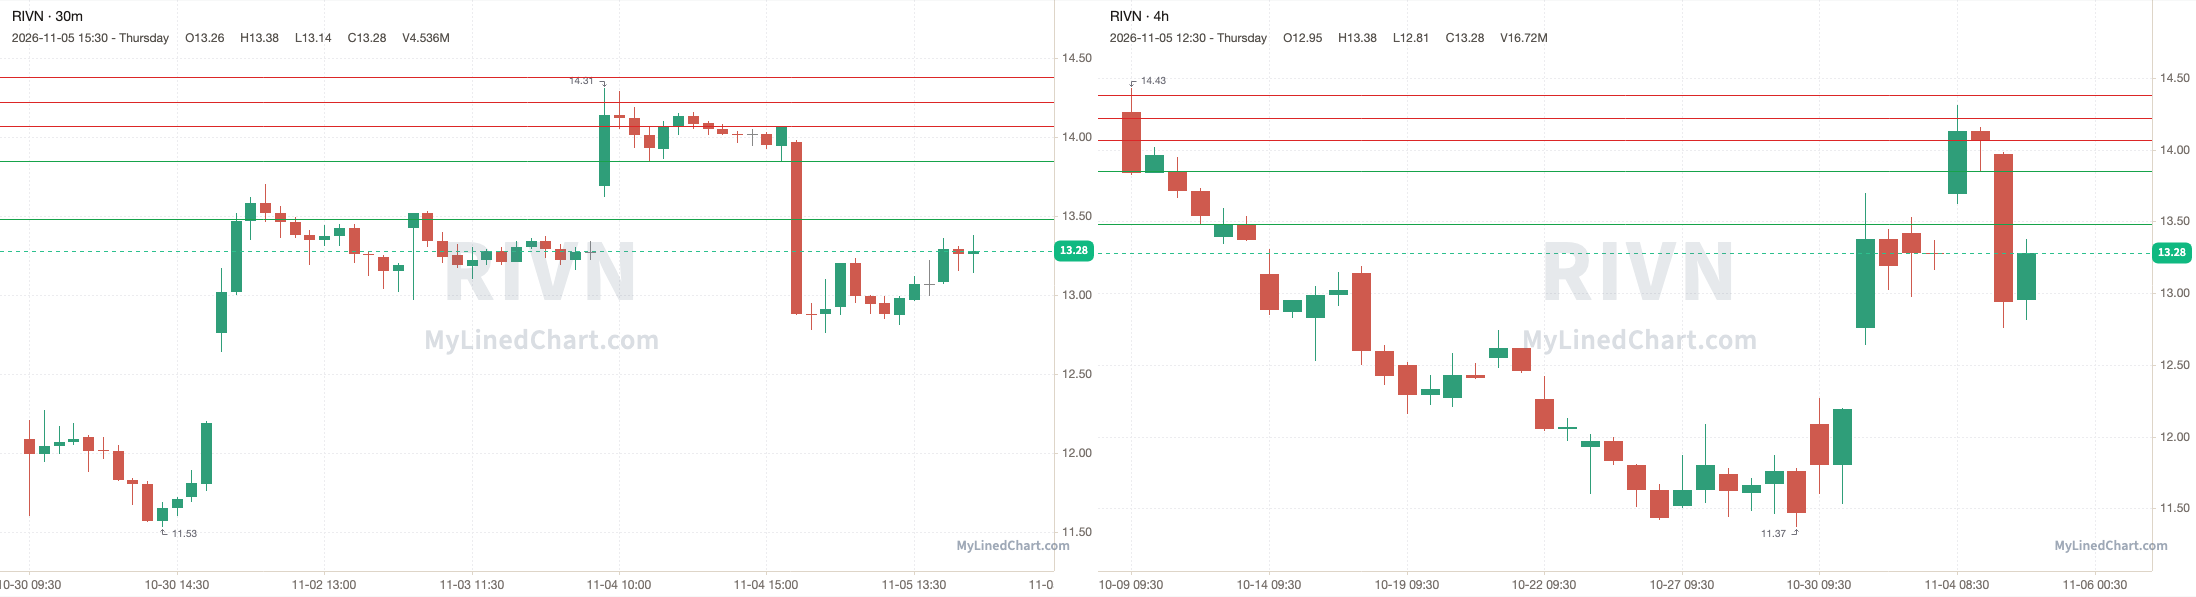
RIVN opened at 13.97, stayed under the 14.07 pivot and ran through every support level down to 13.48, and kept going to a low of 12.76, then ended up closing at 13.28. Finishing the trading session down 4.94% intraday and down 5.55% overall.
November 5th session levels:
All listed levels: 13.48, 13.85, 14.07, 14.22, 14.38
Resistance above: 14.07, 14.22, 14.38
Support below: 13.85, 13.48
Nearest pivot: 14.07
Above 14.07 → 14.22 next
Lose 13.85 → 13.48 next
Day Trade Levels for the November 6th Trading Session:
Disclaimer: Little Bird Trading and any of its associations may or may not, whether long or short, have a position in any instruments. Not investment advice. Provided for informational purposes only. Not a recommendation or endorsement. Not registered or licensed. Model portfolios are property of their respective owners. All data is sourced from publicly available information. No guarantee is being made or offered. Not responsible for financial loss or ruin. Little Bird Trading may earn a commission if you purchase through links on the site.