
Active Traders · NVDA, TSLA, BTC, GLD, CL and more
GME, NVDA, TSLA, INTC, RIVN and 19 More Support and Resistance, Pivots and Highest Volume Levels for Day Traders, Nov 10
Published · Lee H.
MyLinedChart works however you get to a trade: AI-Assisted, Discretionary, Quant, or Macro. Export your lines, levels plus the whole chart as XLSX, JSON, or CSV. Or, let AI do all the work for you.
Here’s an overview of how MyLinedChart compares to TradingView and TrendSpider. Available on Windows, Apple and Android.
Looking for a pro to build your trading workflows? Reach out on Upwork.
A recap of how the November 9th trading session and levels played out:
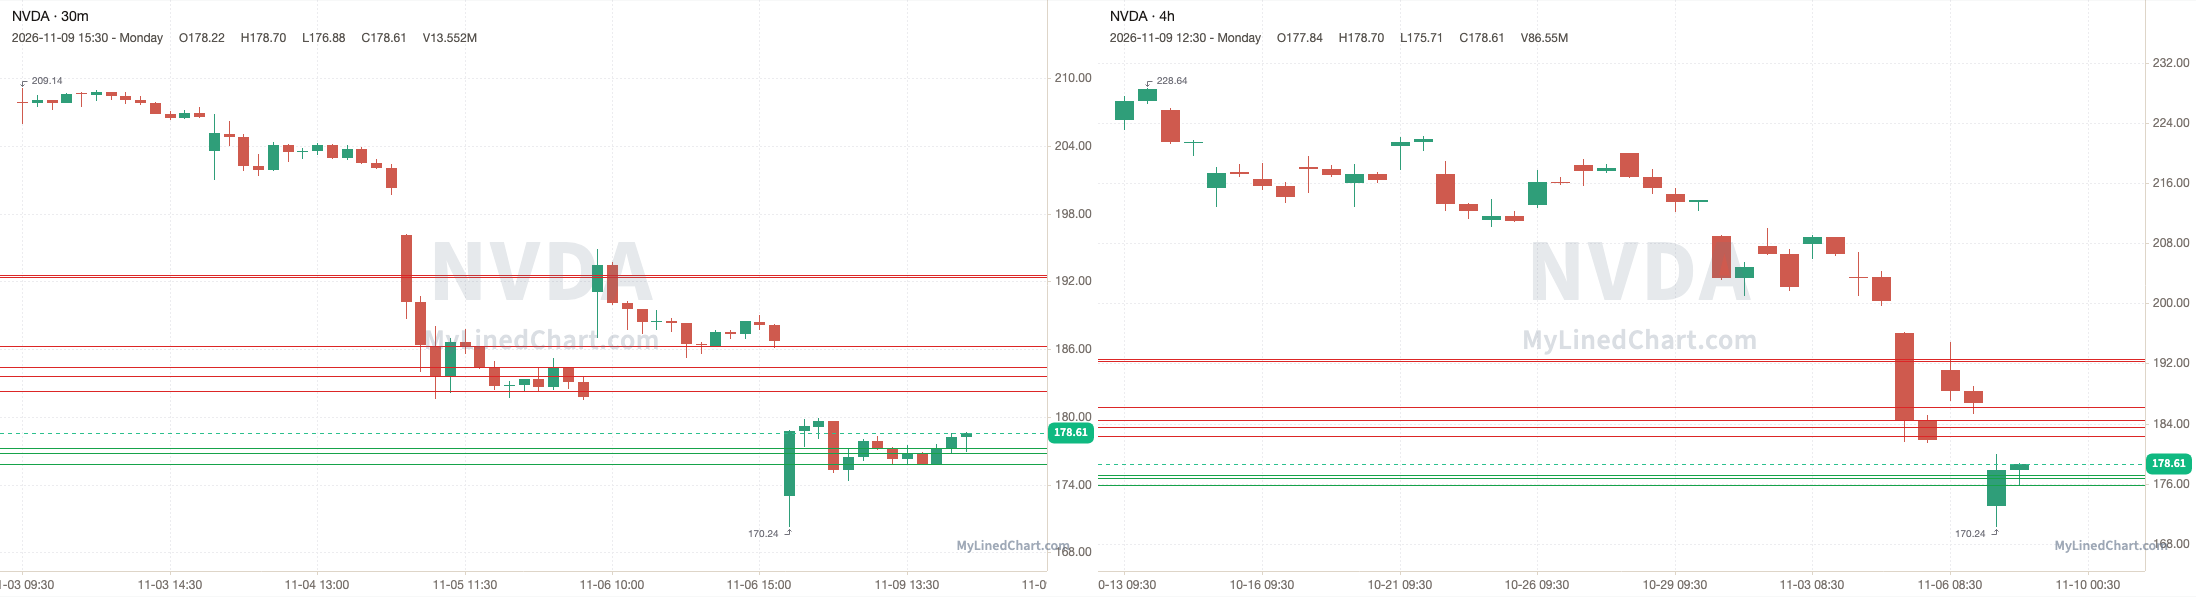
NVDA (NVIDIA)
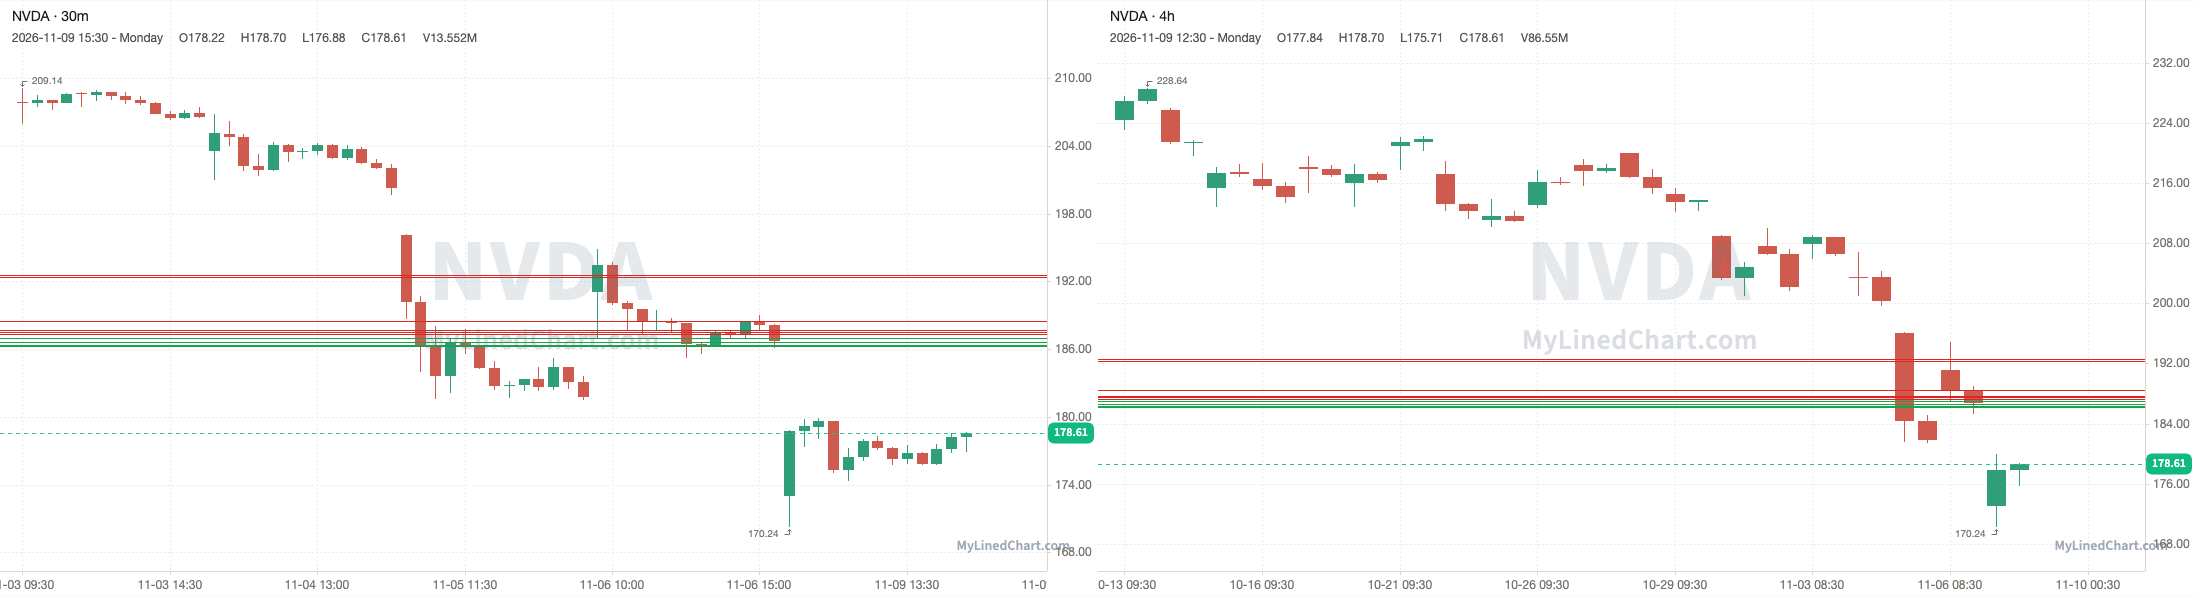
NVDA opened at 172.99, under the 186.95 pivot and every level in the plan, and never traded back up to them, with a high of 179.92 and a low of 170.24, then ended up closing at 178.61. Finishing the trading session up 3.25% intraday and down 4.67% overall.
November 9th session levels:
All listed levels: 186.24, 186.33, 186.62, 186.95, 187.32, 187.54, 187.71, 188.47, 192.36, 192.56
Resistance above: 187.32, 187.54, 187.71, 188.47, 192.36, 192.56
Support below: 186.95, 186.62, 186.33, 186.24
Nearest pivot: 186.95
Above 187.32 → 187.54 next
Lose 186.95 → 186.62 next
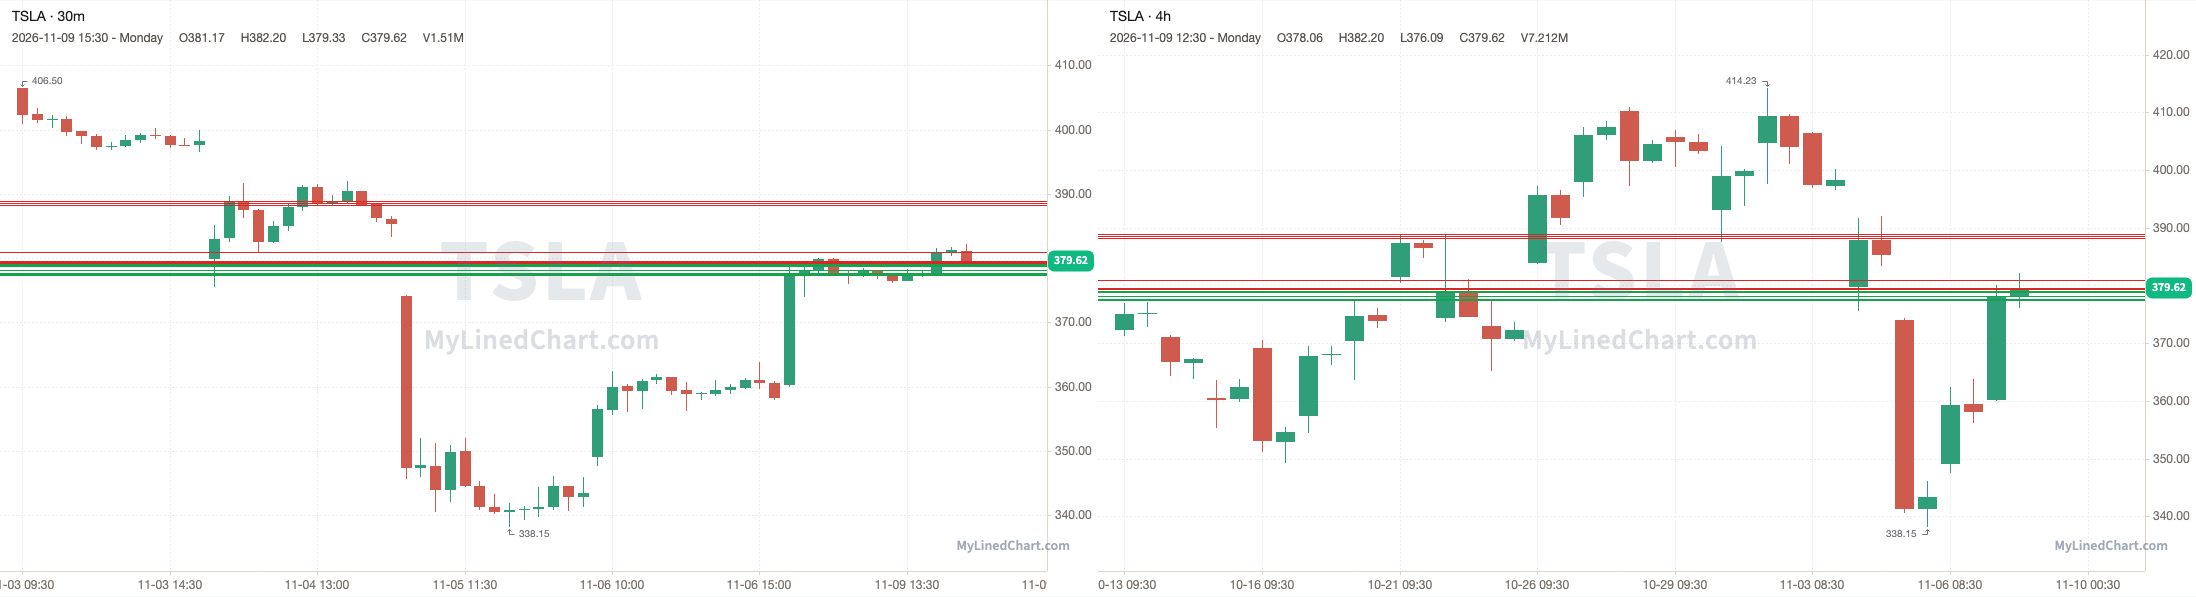
TSLA (Tesla)
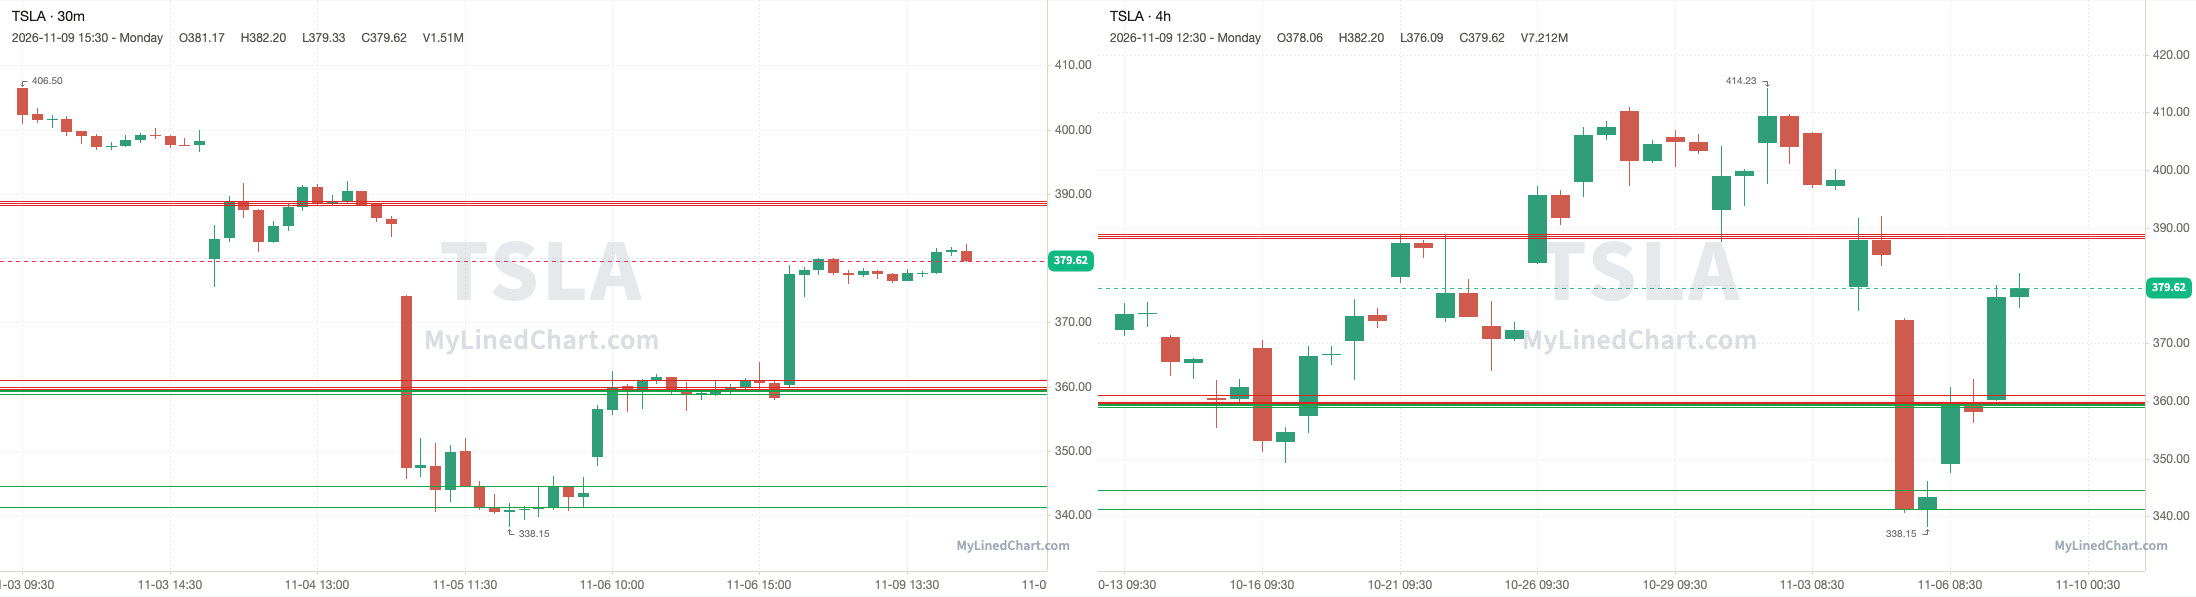
TSLA opened at 360.19, held above the 359.41 pivot and ran up to tag 360.96, with a high of 382.20, then ended up closing at 379.62. Finishing the trading session up 5.39% intraday and up 5.54% overall.
November 9th session levels:
All listed levels: 341.23, 344.52, 358.90, 359.29, 359.41, 359.58, 359.88, 360.96, 388.22, 388.54, 388.91
Resistance above: 359.58, 359.88, 360.96, 388.22, 388.54, 388.91
Support below: 359.41, 359.29, 358.90, 344.52, 341.23
Nearest pivot: 359.41
Above 359.58 → 359.88 next
Lose 359.41 → 359.29 next
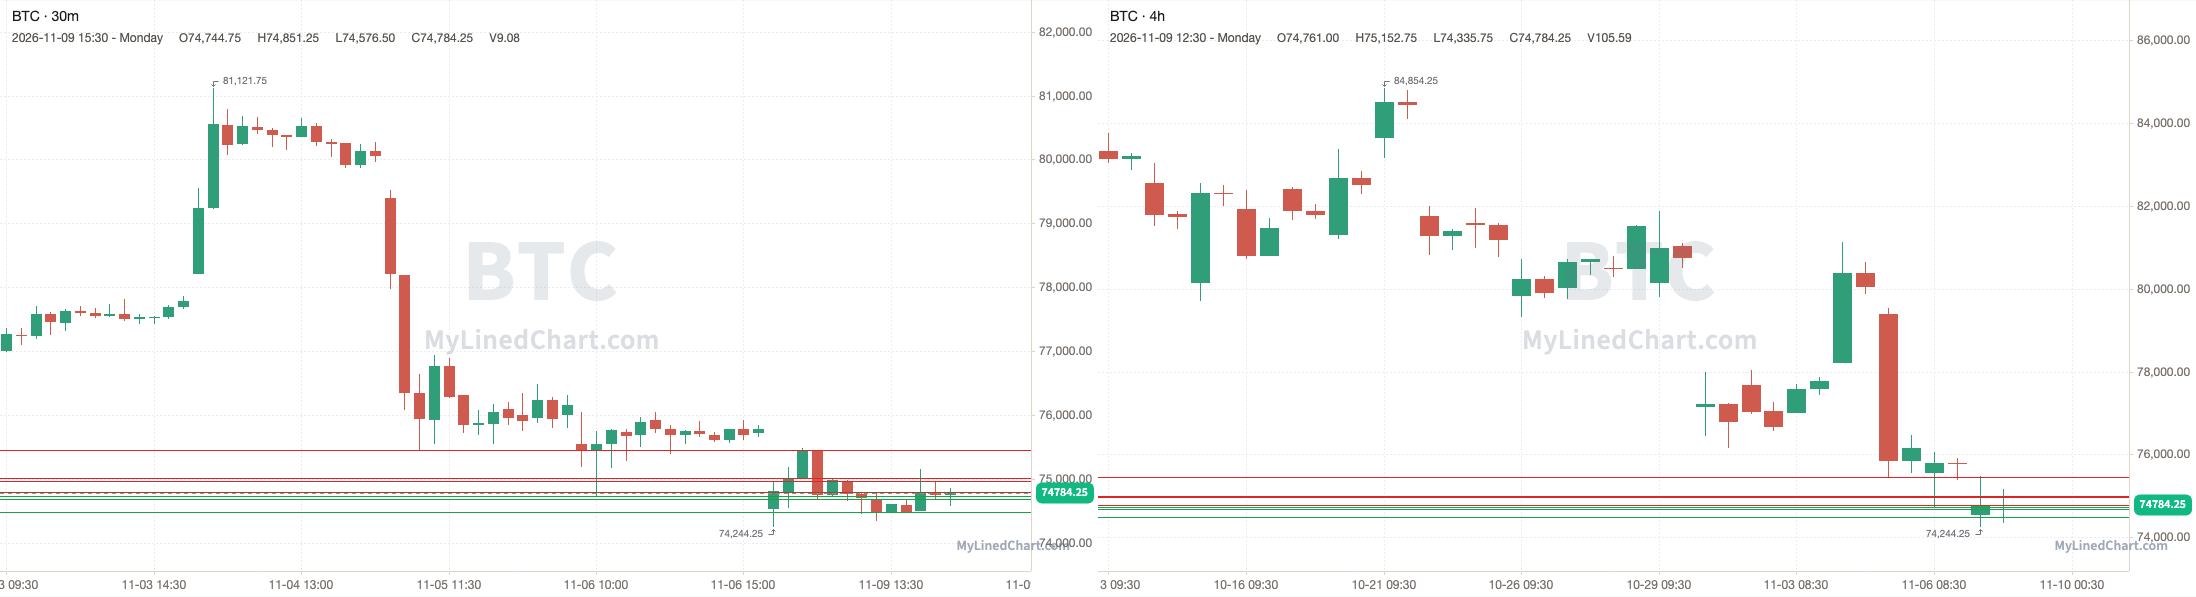
BTC (Bitcoin)
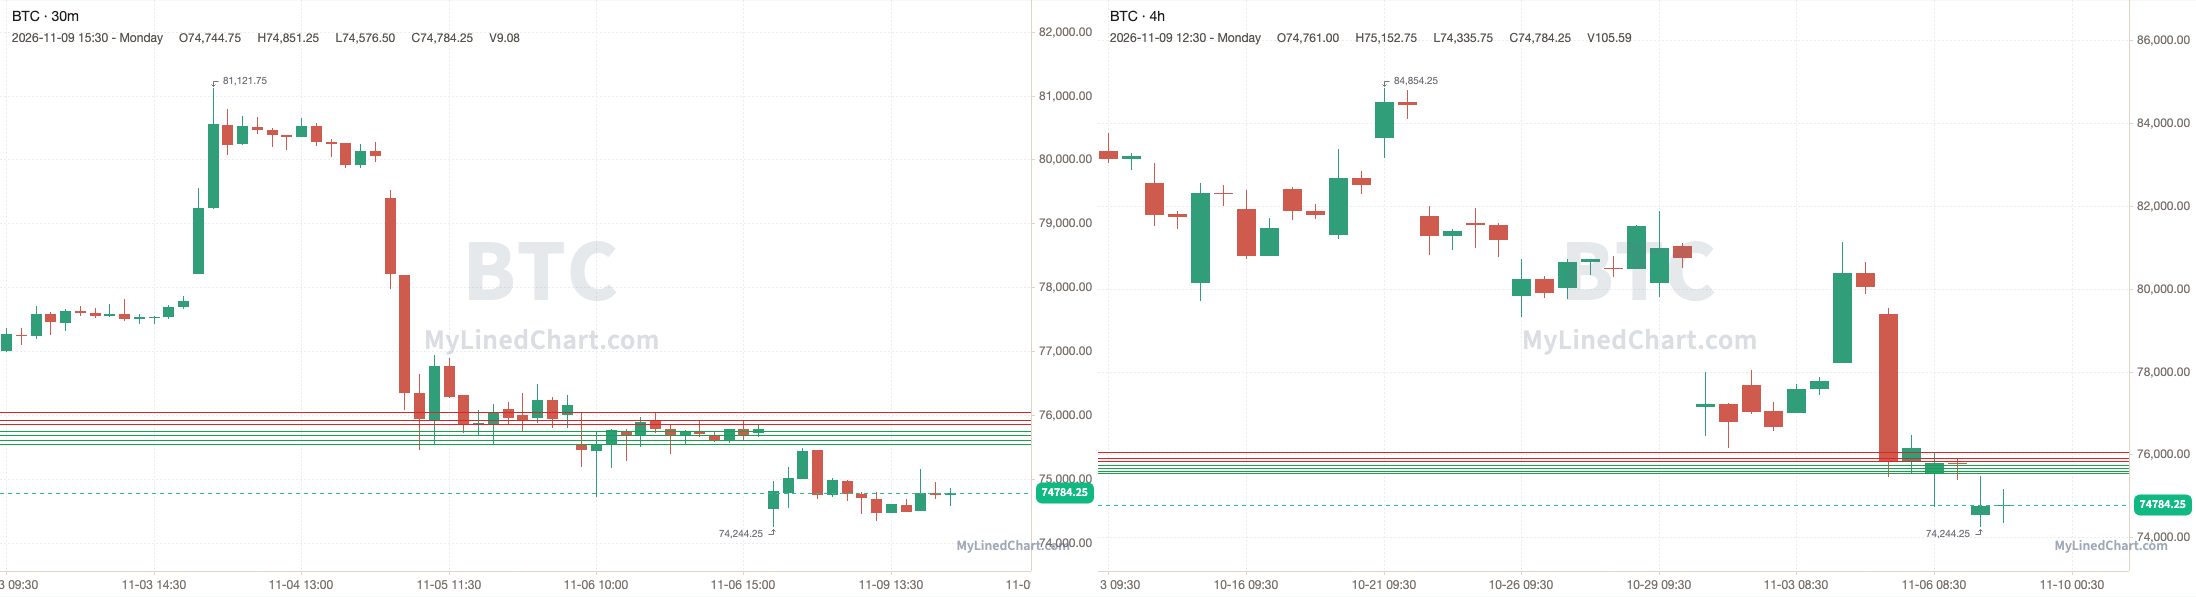
BTC opened at 74534.50, under the 75750.25 pivot and every level in the plan, and never traded back up to them, with a high of 75479.25 and a low of 74244.25, then ended up closing at 74784.25. Finishing the trading session up 0.34% intraday and down 1.31% overall.
November 9th session levels:
All listed levels: 75546.50, 75609.50, 75679.75, 75750.25, 75850.50, 75924, 76047.50
Resistance above: 75850.50, 75924, 76047.50
Support below: 75750.25, 75679.75, 75609.50, 75546.50
Nearest pivot: 75750.25
Above 75850.50 → 75924 next
Lose 75750.25 → 75679.75 next
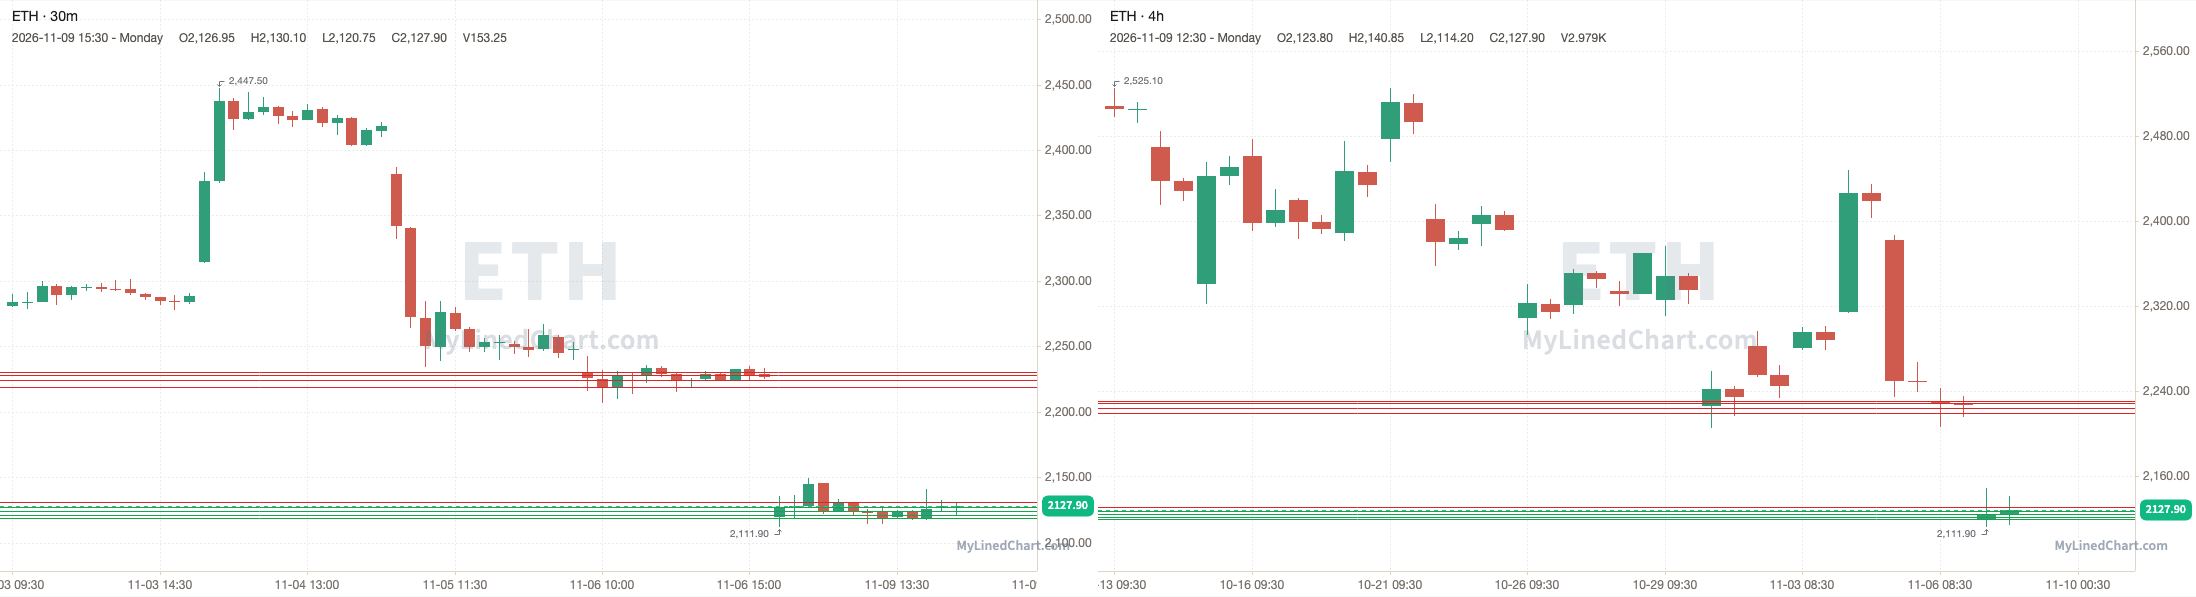
ETH (Ethereum)
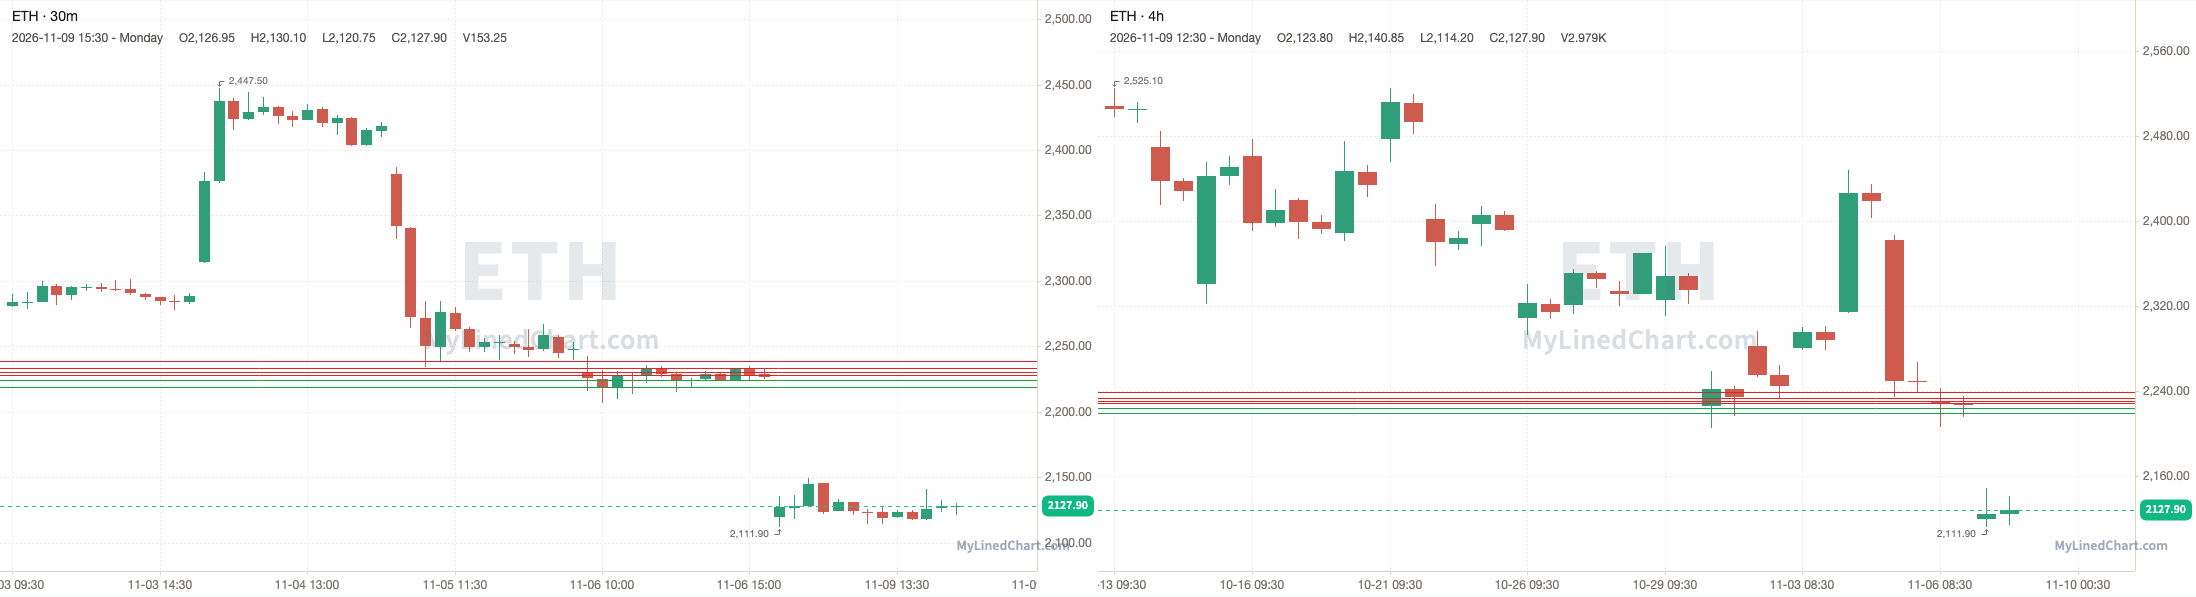
ETH opened at 2119.40, under the 2228.30 pivot and every level in the plan, and never traded back up to them, with a high of 2149.05 and a low of 2111.90, then ended up closing at 2127.90. Finishing the trading session up 0.40% intraday and down 4.43% overall.
November 9th session levels:
All listed levels: 2219.30, 2224.35, 2228.30, 2230.45, 2233.70, 2239.10
Resistance above: 2228.30, 2230.45, 2233.70, 2239.10
Support below: 2224.35, 2219.30
Nearest pivot: 2228.30
Above 2228.30 → 2230.45 next
Lose 2224.35 → 2219.30 next
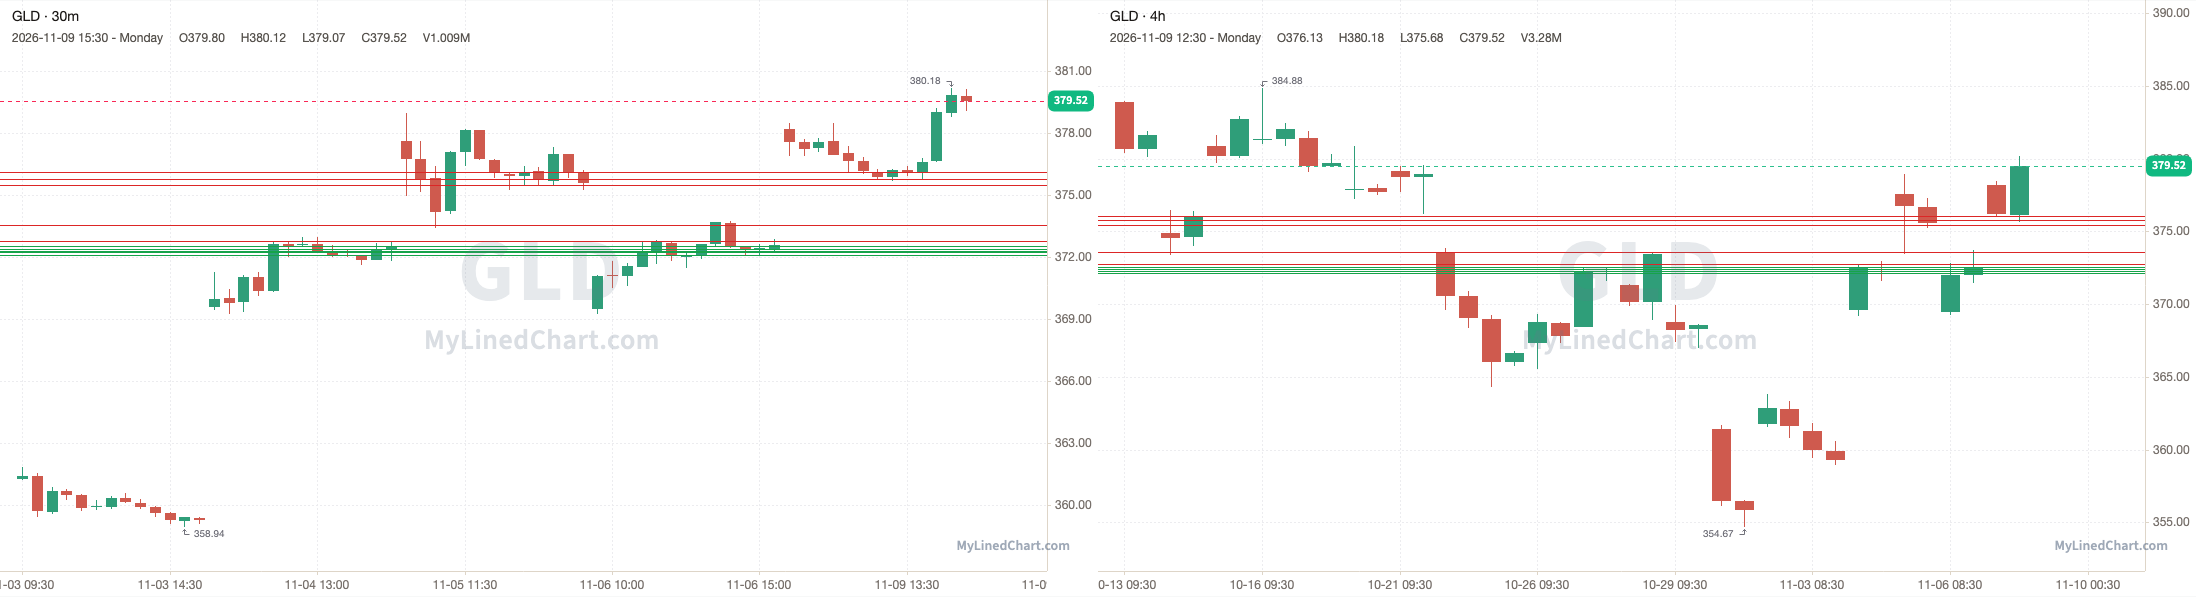
GLD (SPDR Gold Shares)
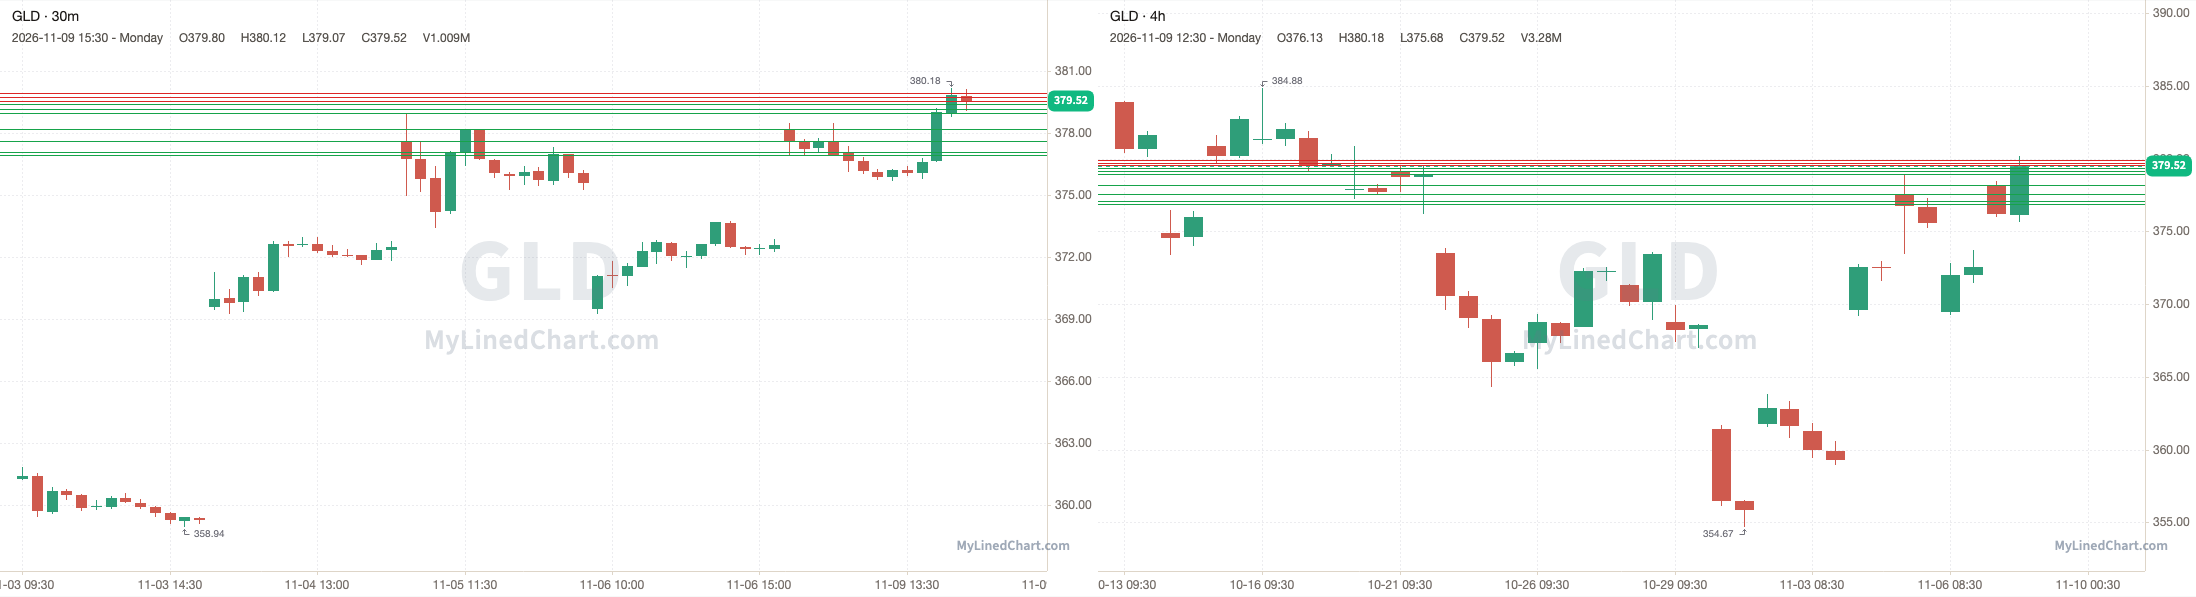
GLD opened at 378.20, held above the 372.55 pivot and pushed to a high of 380.18, then ended up closing at 379.52. Finishing the trading session up 0.35% intraday and up 1.87% overall.
November 9th session levels:
All listed levels: 372.12, 372.26, 372.31, 372.39, 372.55, 372.76, 373.57, 375.46, 375.79, 376.09
Resistance above: 372.76, 373.57, 375.46, 375.79, 376.09
Support below: 372.55, 372.39, 372.31, 372.26, 372.12
Nearest pivot: 372.55
Above 372.76 → 373.57 next
Lose 372.55 → 372.39 next
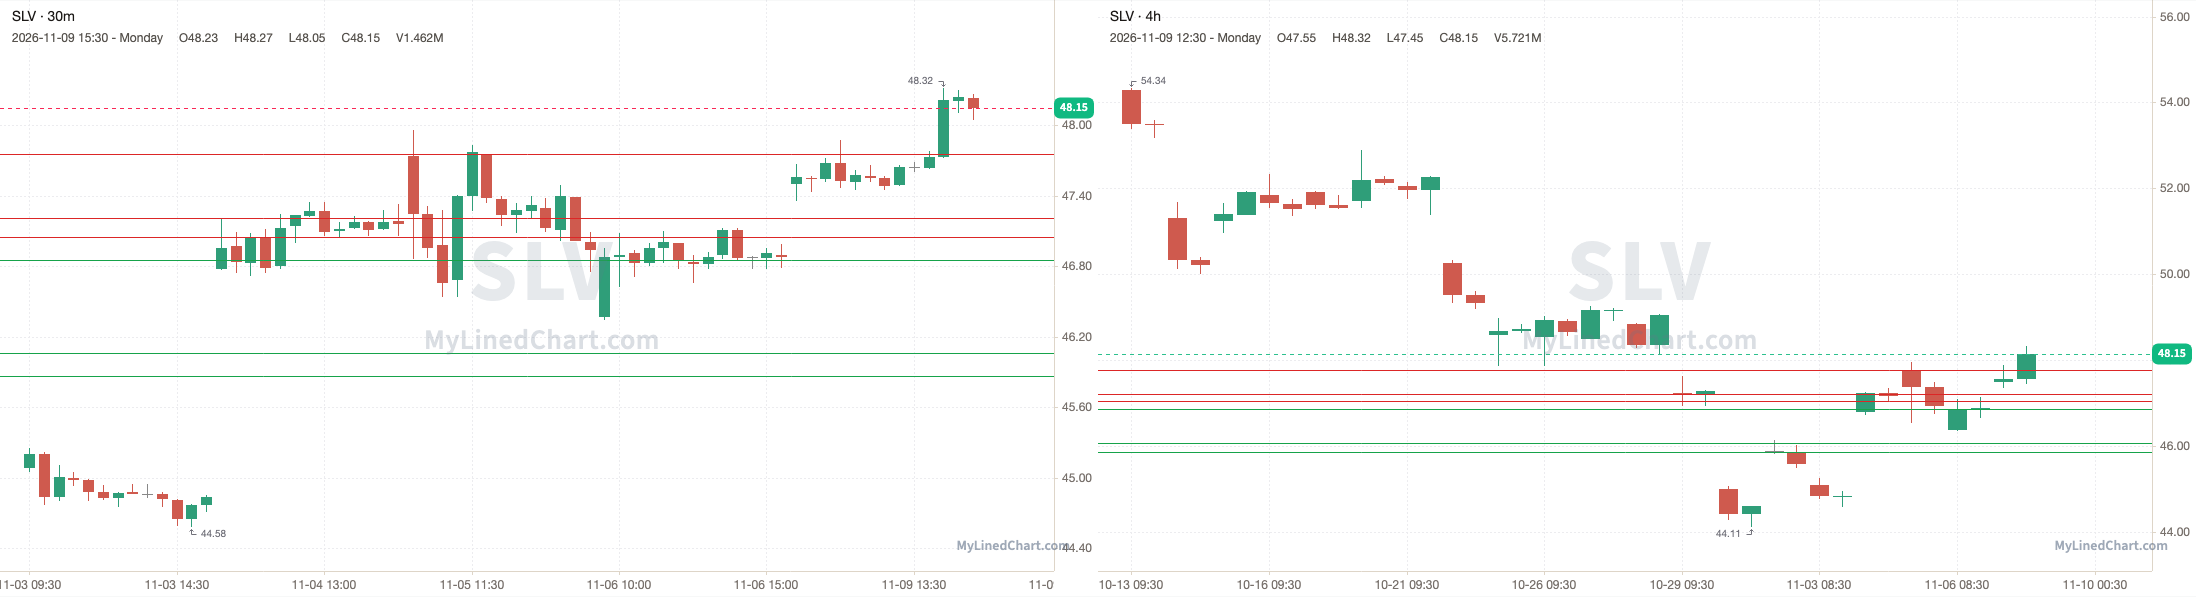
SLV (iShares Silver Trust)
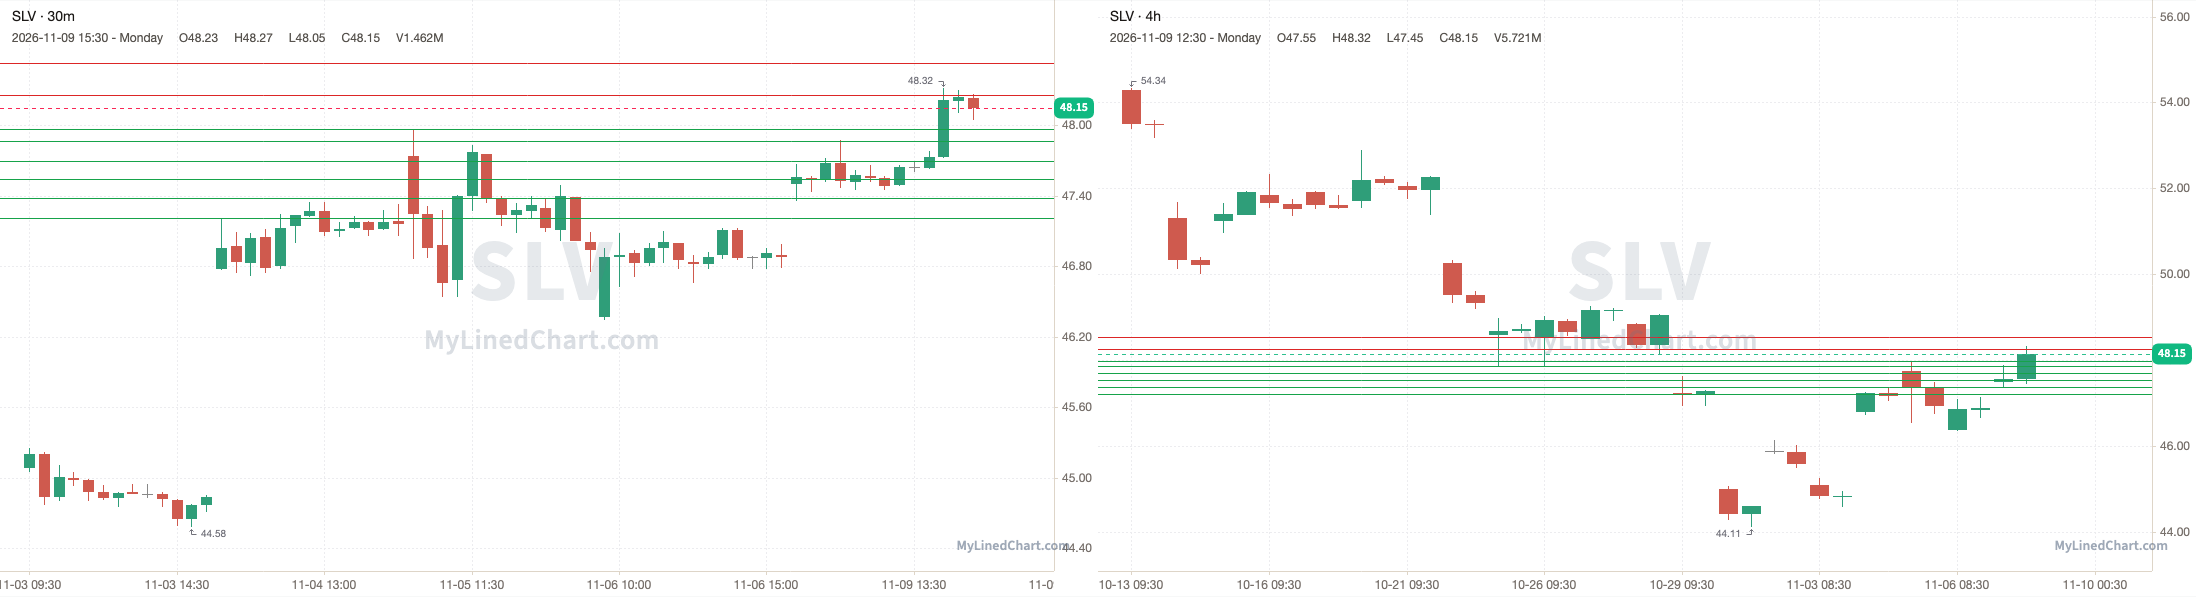
SLV opened at 47.50, held above the 46.85 pivot and ran up to tag 47.76, with a high of 48.32, then ended up closing at 48.15. Finishing the trading session up 1.37% intraday and up 2.71% overall.
November 9th session levels:
All listed levels: 45.87, 46.06, 46.85, 47.05, 47.21, 47.76
Resistance above: 47.05, 47.21, 47.76
Support below: 46.85, 46.06, 45.87
Nearest pivot: 46.85
Above 47.05 → 47.21 next
Lose 46.85 → 46.06 next
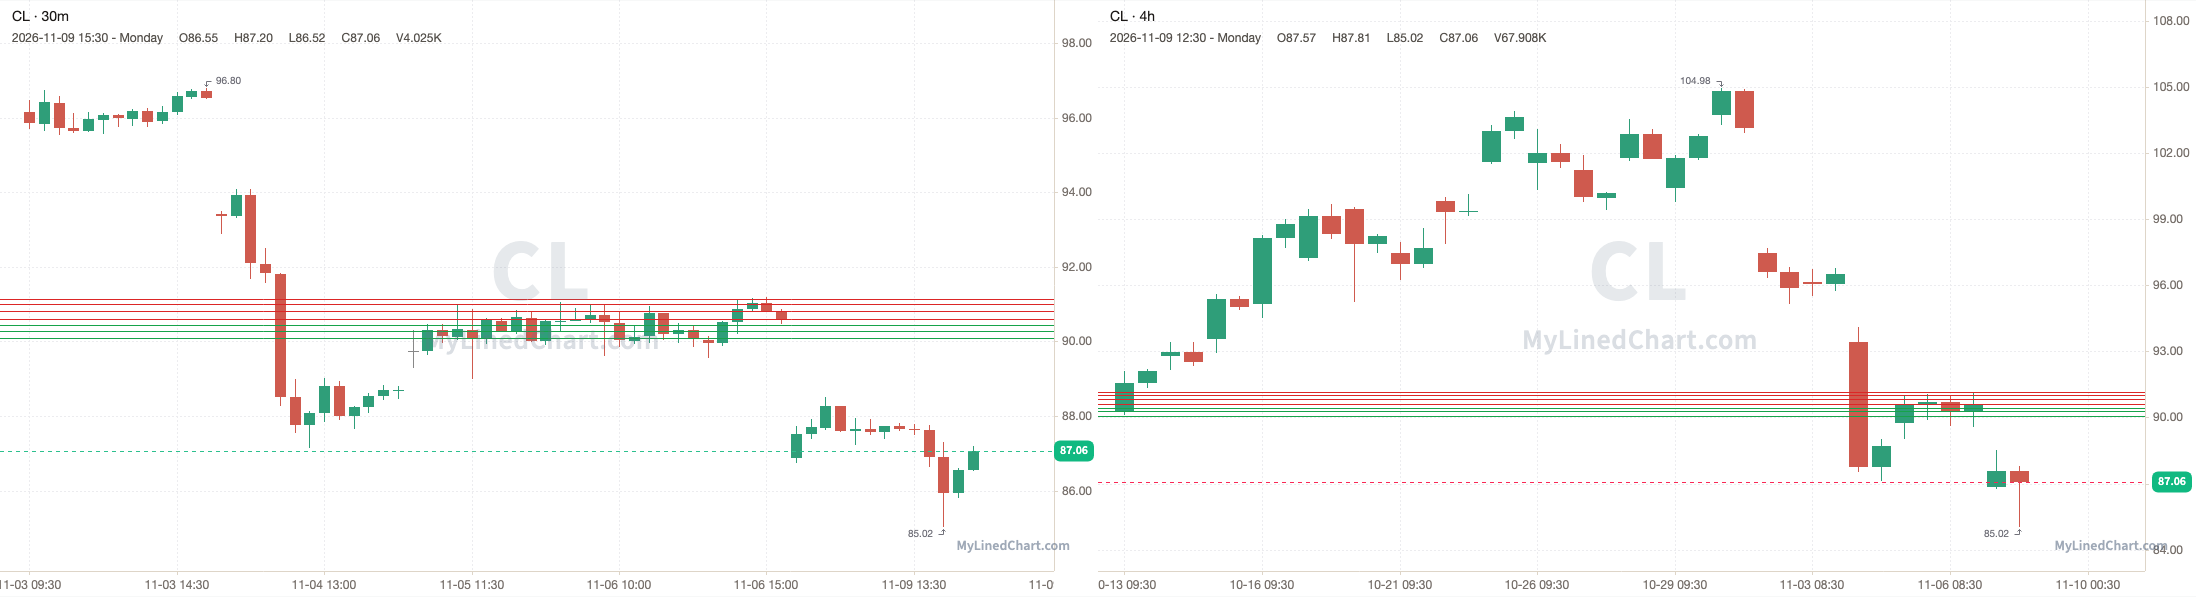
CL (Crude Oil futures)
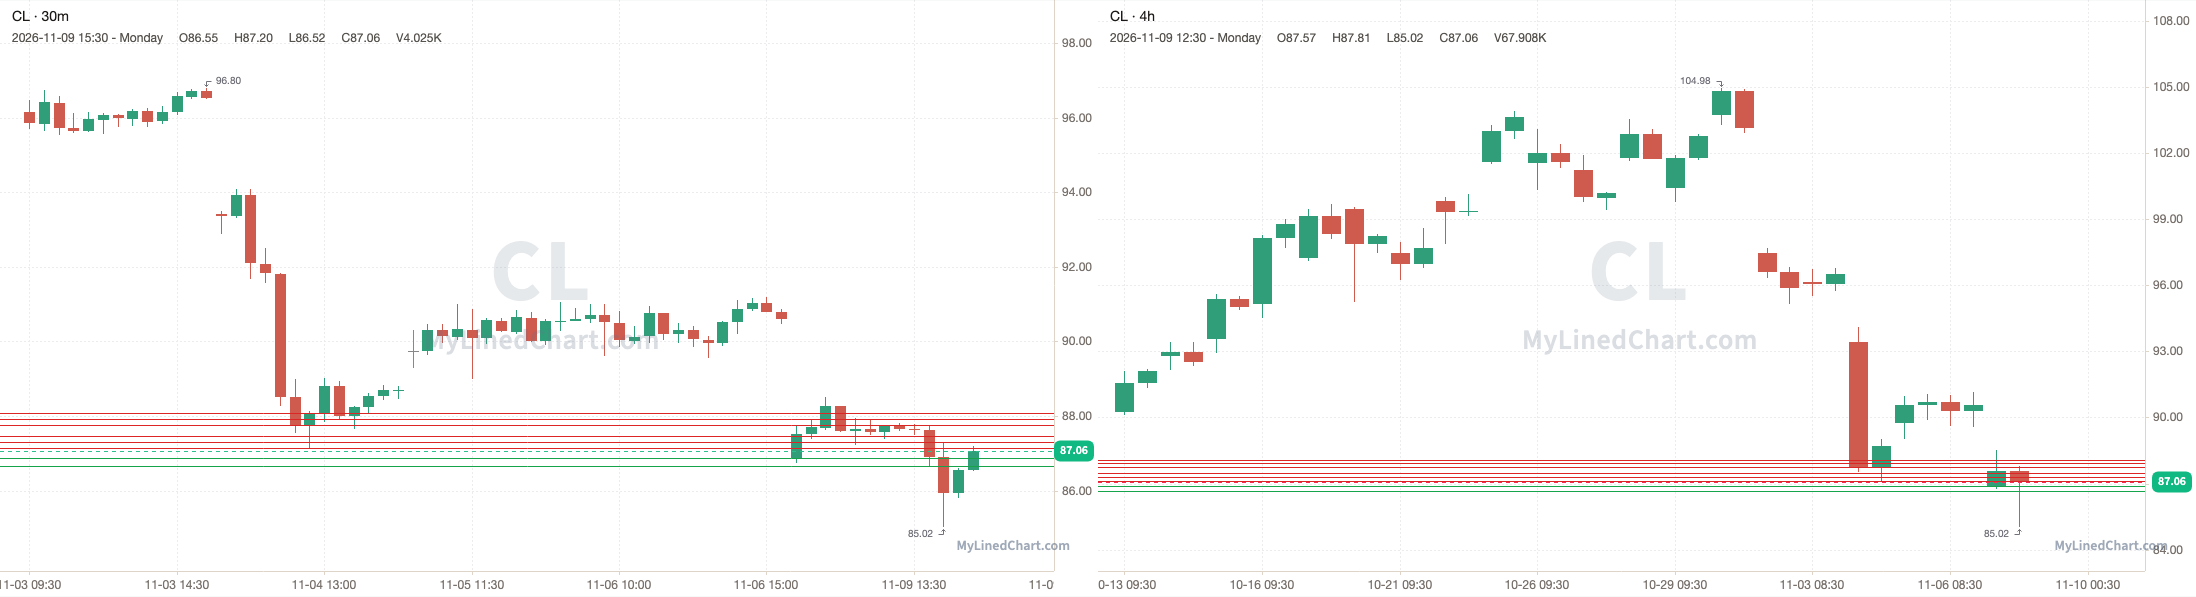
CL opened at 86.86, under the 90.61 pivot and every level in the plan, and never traded back up to them, with a high of 88.50 and a low of 85.02, then ended up closing at 87.06. Finishing the trading session up 0.23% intraday.
November 9th session levels:
All listed levels: 90.08, 90.29, 90.45, 90.61, 90.82, 91.01, 91.15
Resistance above: 90.61, 90.82, 91.01, 91.15
Support below: 90.45, 90.29, 90.08
Nearest pivot: 90.61
Above 90.61 → 90.82 next
Lose 90.45 → 90.29 next
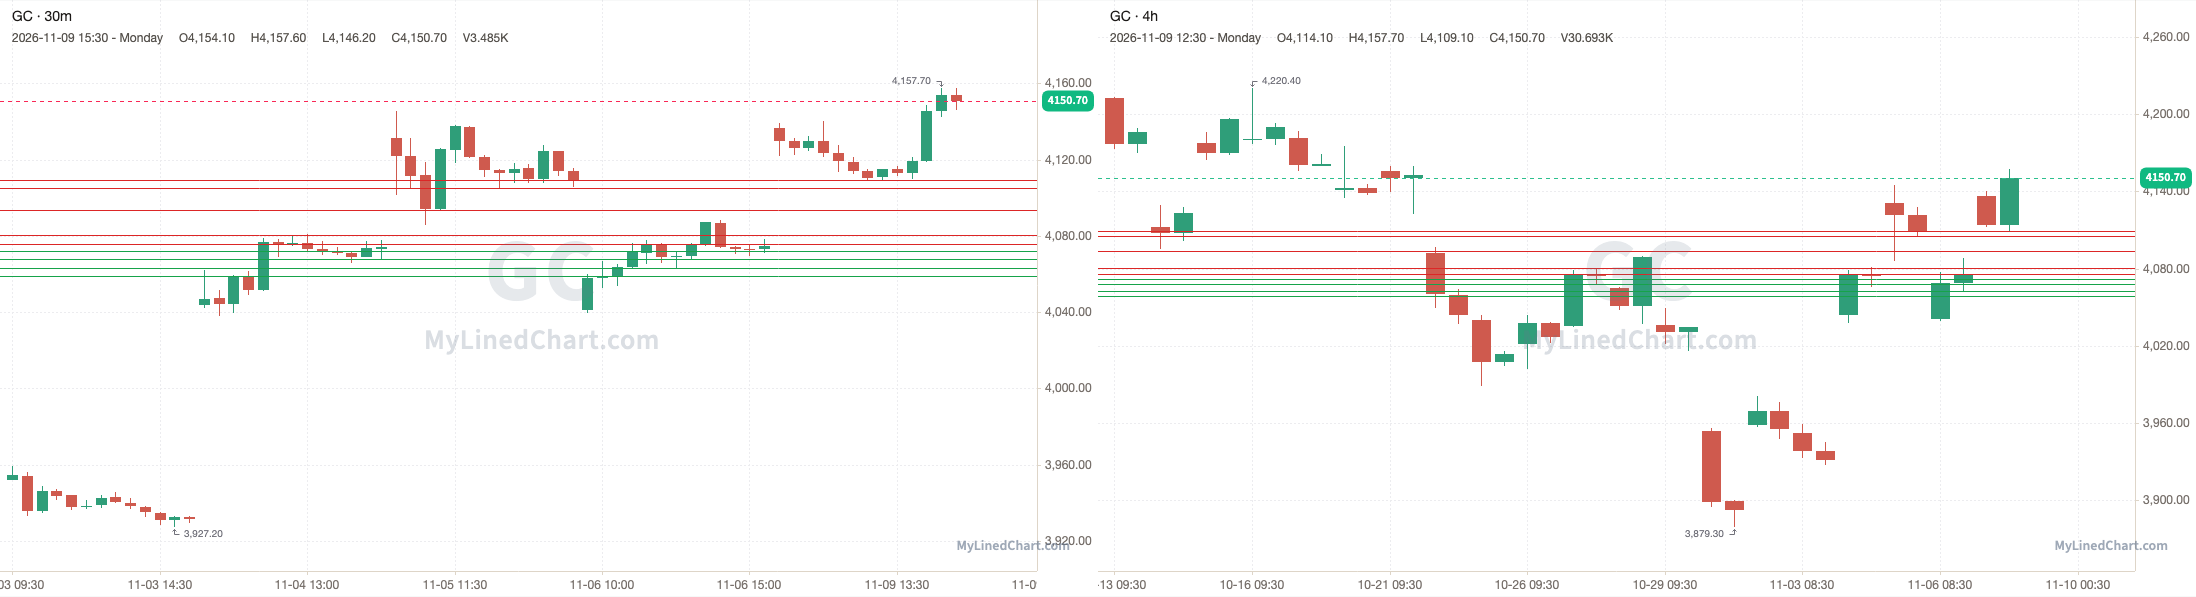
GC (Gold futures)
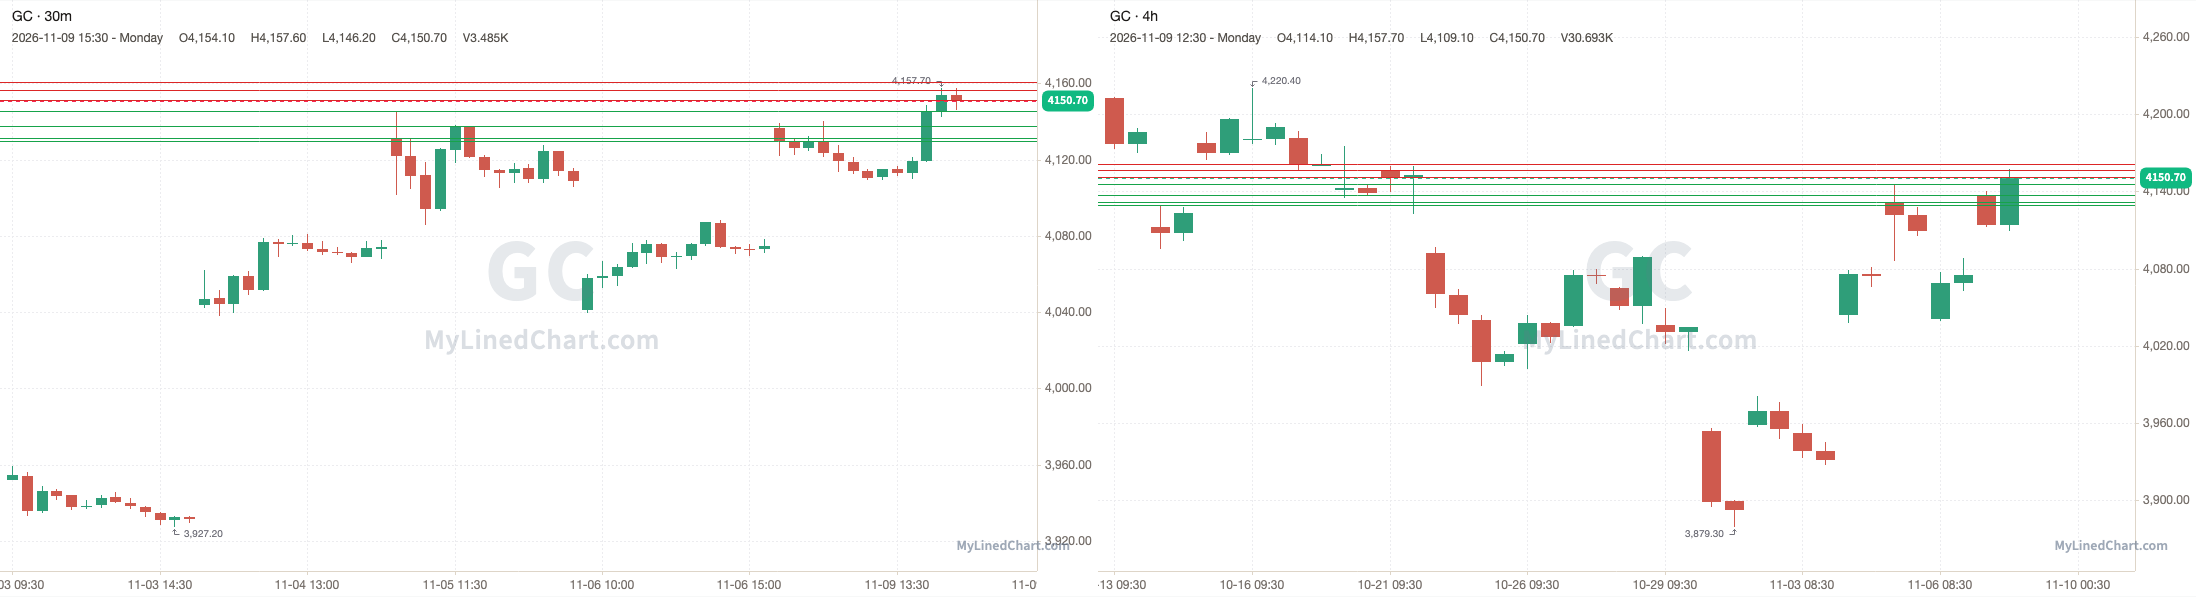
GC opened at 4136.70, held above the 4075.80 pivot and pushed to a high of 4157.70, then ended up closing at 4150.70. Finishing the trading session up 0.34% intraday.
November 9th session levels:
All listed levels: 4059, 4062.90, 4067.70, 4071.90, 4075.80, 4080.30, 4093.80, 4105.20, 4109.60
Resistance above: 4075.80, 4080.30, 4093.80, 4105.20, 4109.60
Support below: 4071.90, 4067.70, 4062.90, 4059
Nearest pivot: 4075.80
Above 4075.80 → 4080.30 next
Lose 4071.90 → 4067.70 next
AMD (Advanced Micro Devices)
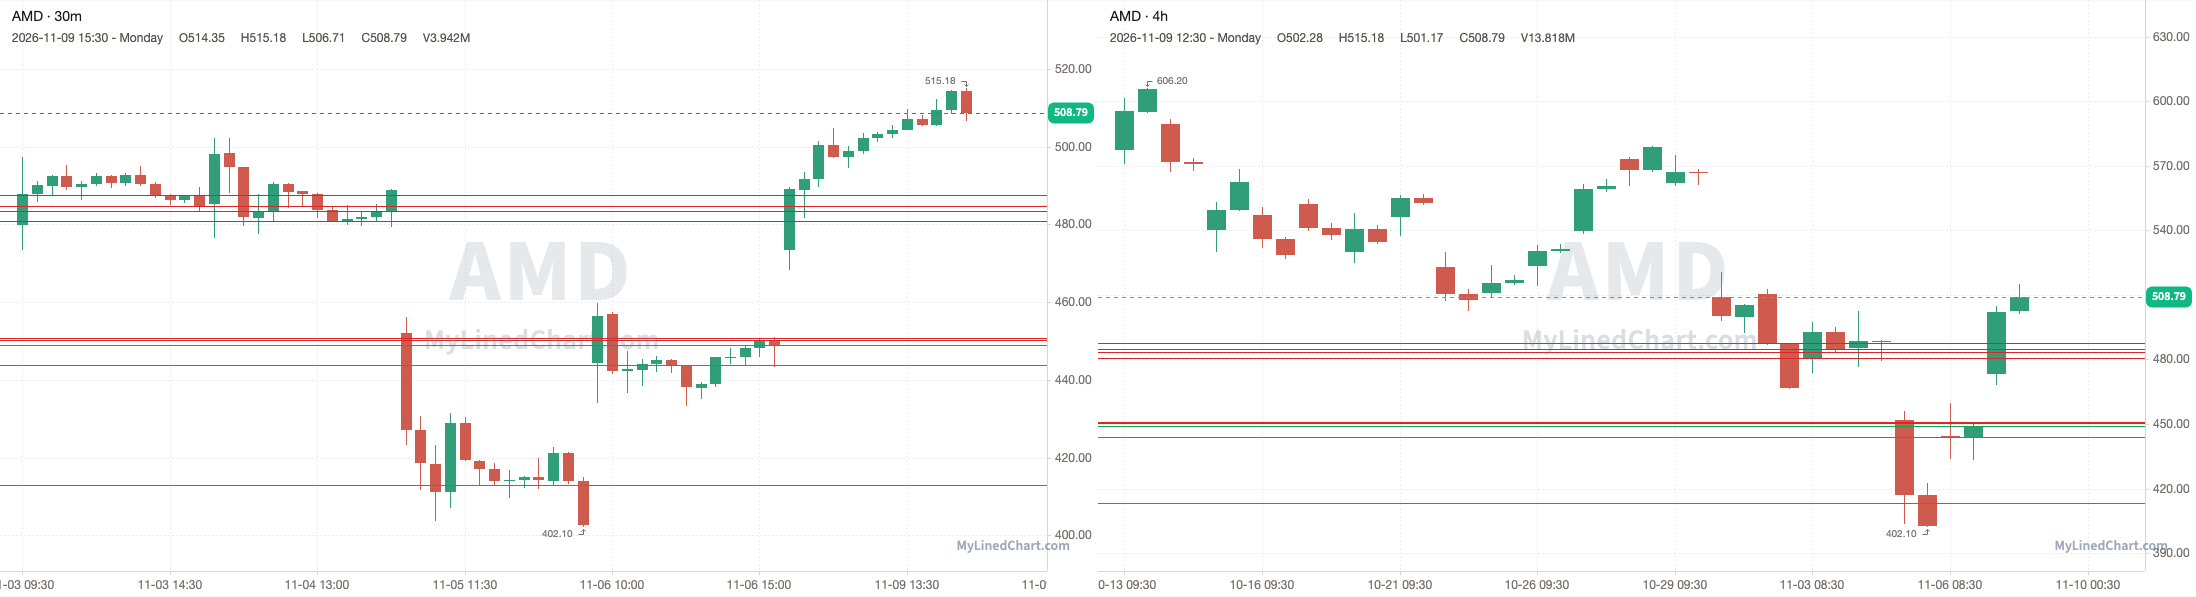
AMD opened at 473.39, held above the 448.98 pivot and ran up to tag 487.59, with a high of 515.18, then ended up closing at 508.79. Finishing the trading session up 7.48% intraday and up 13.31% overall.
November 9th session levels:
All listed levels: 413.06, 443.79, 448.88, 448.98, 450.37, 450.82, 480.79, 483.39, 484.70, 487.59
Resistance above: 450.37, 450.82, 480.79, 483.39, 484.70, 487.59
Support below: 448.98, 448.88, 443.79, 413.06
Nearest pivot: 448.98
Above 450.37 → 450.82 next
Lose 448.98 → 448.88 next
MSTR (Strategy)
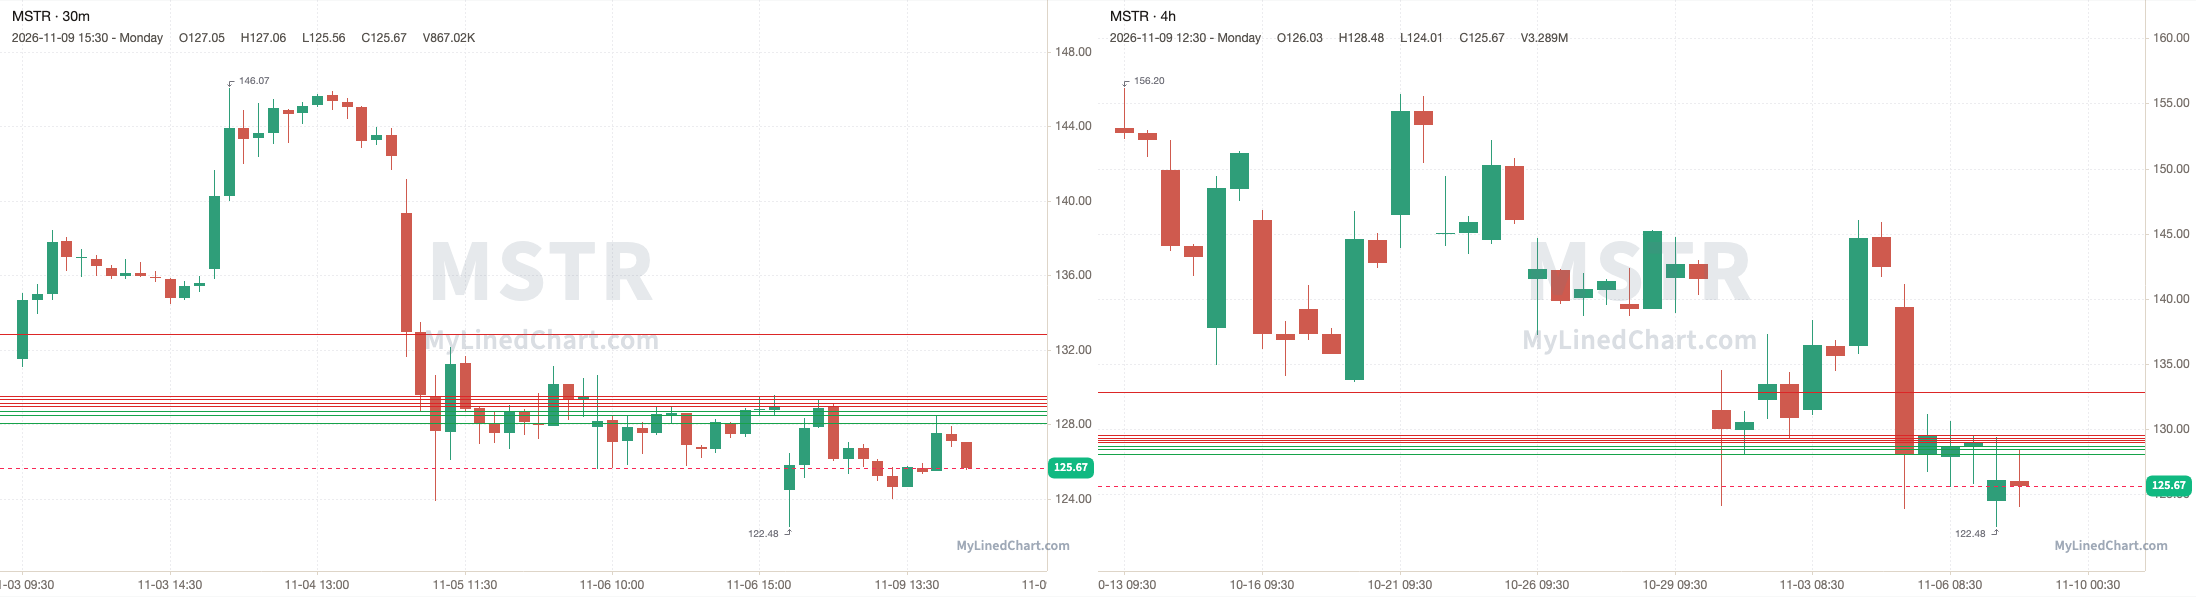
MSTR opened at 124.45, broke above the 128.99 pivot and ran up to tag 129.34, with a high of 129.37, then ended up closing at 125.67. Finishing the trading session up 0.98% intraday and down 2.54% overall.
November 9th session levels:
All listed levels: 128.09, 128.50, 128.70, 128.99, 129.17, 129.34, 129.54, 132.83
Resistance above: 128.99, 129.17, 129.34, 129.54, 132.83
Support below: 128.70, 128.50, 128.09
Nearest pivot: 128.99
Above 128.99 → 129.17 next
Lose 128.70 → 128.50 next
AAPL (Apple)
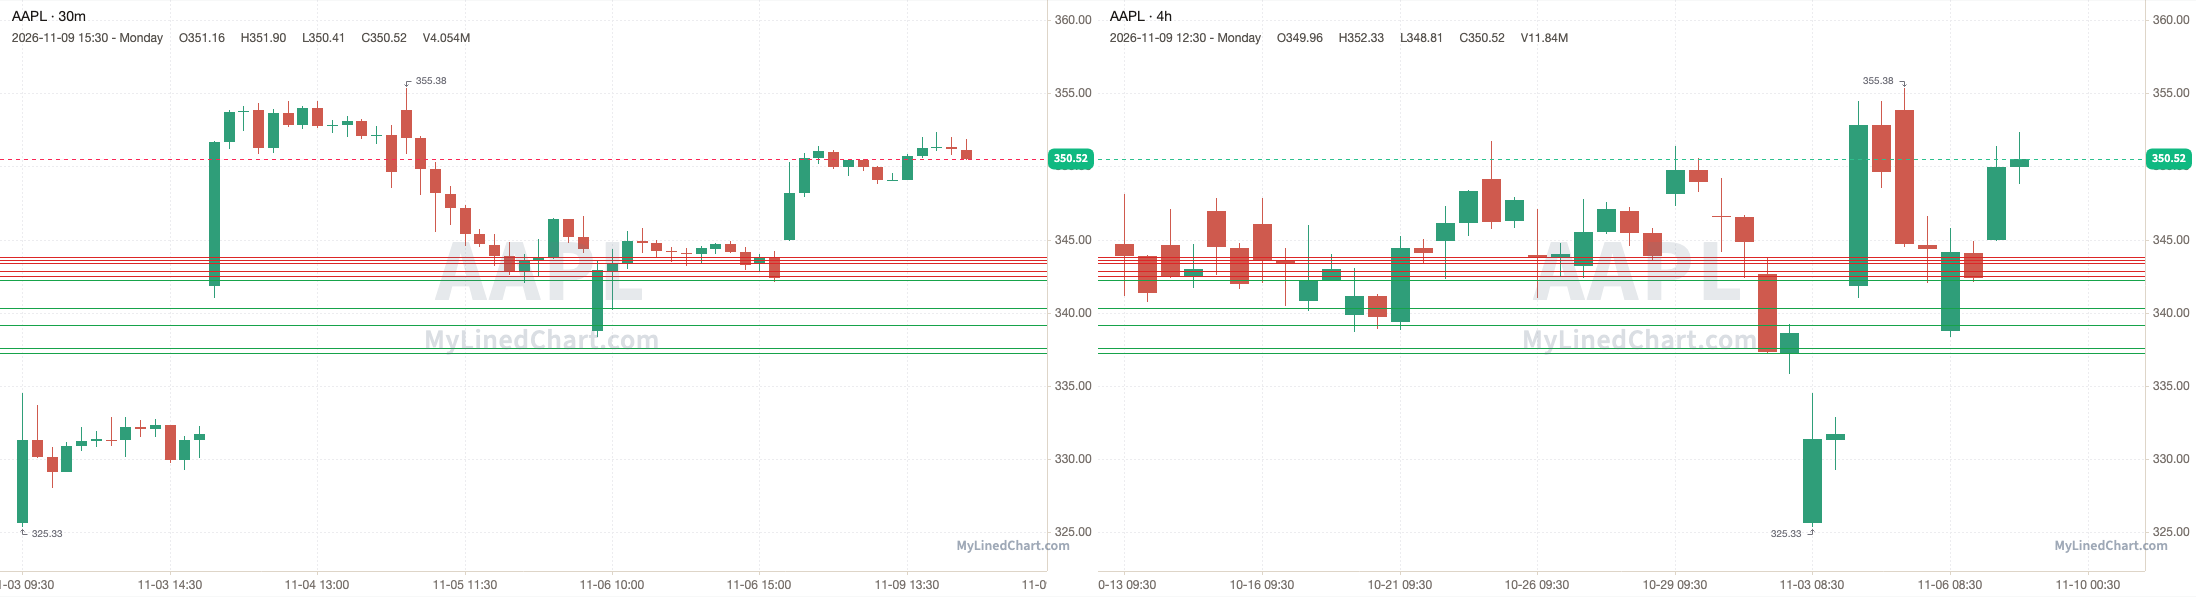
AAPL opened at 345, over the 342.50 pivot and every level in the plan, and never traded back down to them, with a high of 352.33 and a low of 344.87, then ended up closing at 350.52. Finishing the trading session up 1.60% intraday and up 2.38% overall.
November 9th session levels:
All listed levels: 337.27, 337.56, 339.18, 340.34, 342.21, 342.50, 342.82, 343.43, 343.58, 343.78
Resistance above: 342.50, 342.82, 343.43, 343.58, 343.78
Support below: 342.21, 340.34, 339.18, 337.56, 337.27
Nearest pivot: 342.50
Above 342.50 → 342.82 next
Lose 342.21 → 340.34 next
PLTR (Palantir)
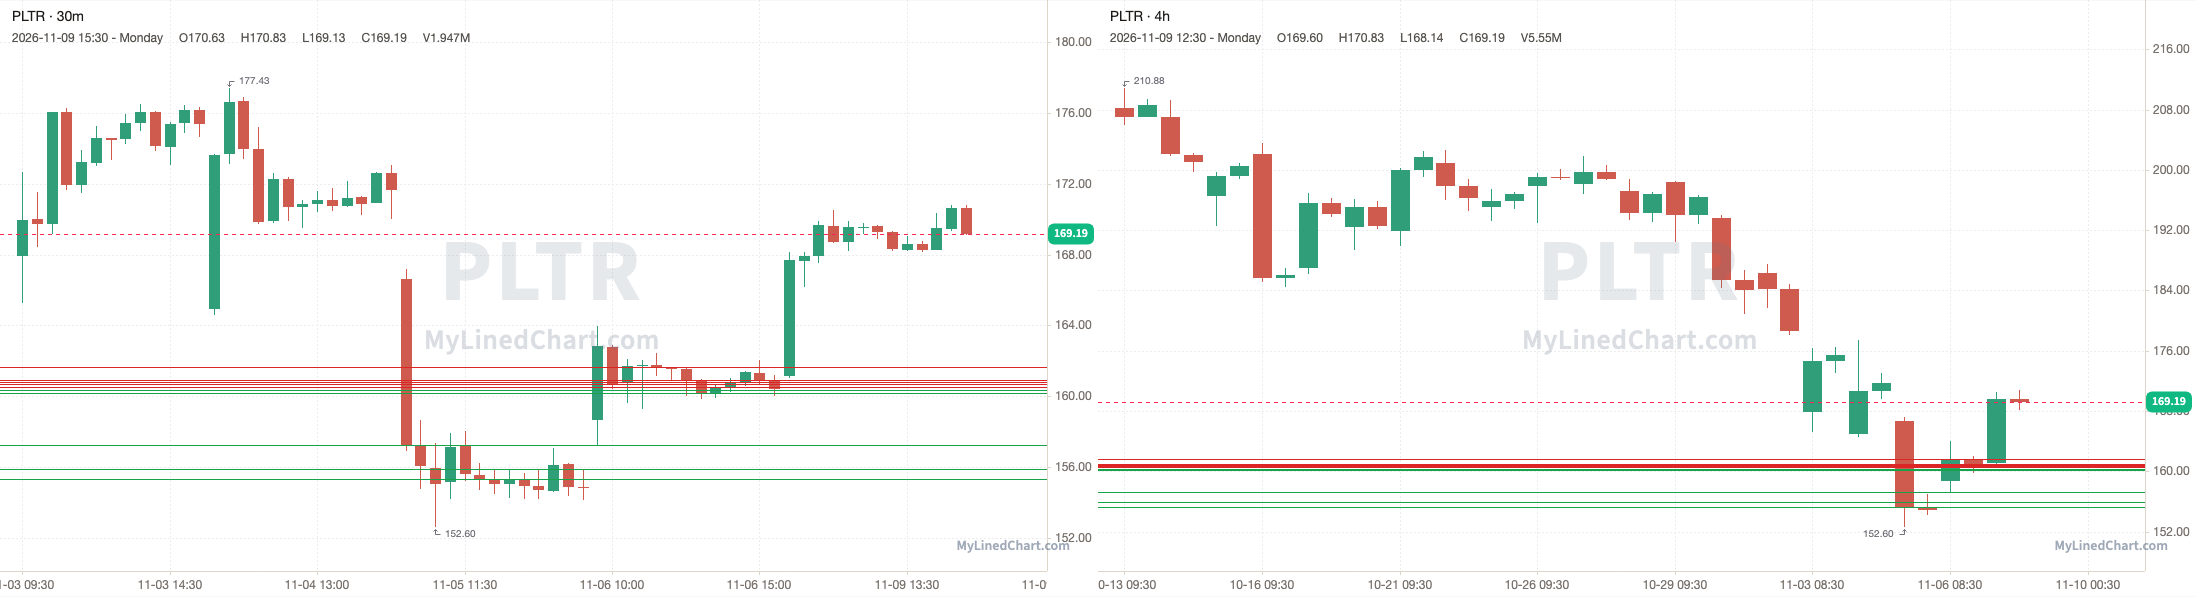
PLTR opened at 161.12, held above the 160.36 pivot and ran up to tag 161.65, with a high of 170.83, then ended up closing at 169.19. Finishing the trading session up 5.01% intraday and up 5.49% overall.
November 9th session levels:
All listed levels: 155.31, 155.87, 157.25, 160.18, 160.36, 160.53, 160.66, 160.79, 160.94, 161.65
Resistance above: 160.53, 160.66, 160.79, 160.94, 161.65
Support below: 160.36, 160.18, 157.25, 155.87, 155.31
Nearest pivot: 160.36
Above 160.53 → 160.66 next
Lose 160.36 → 160.18 next
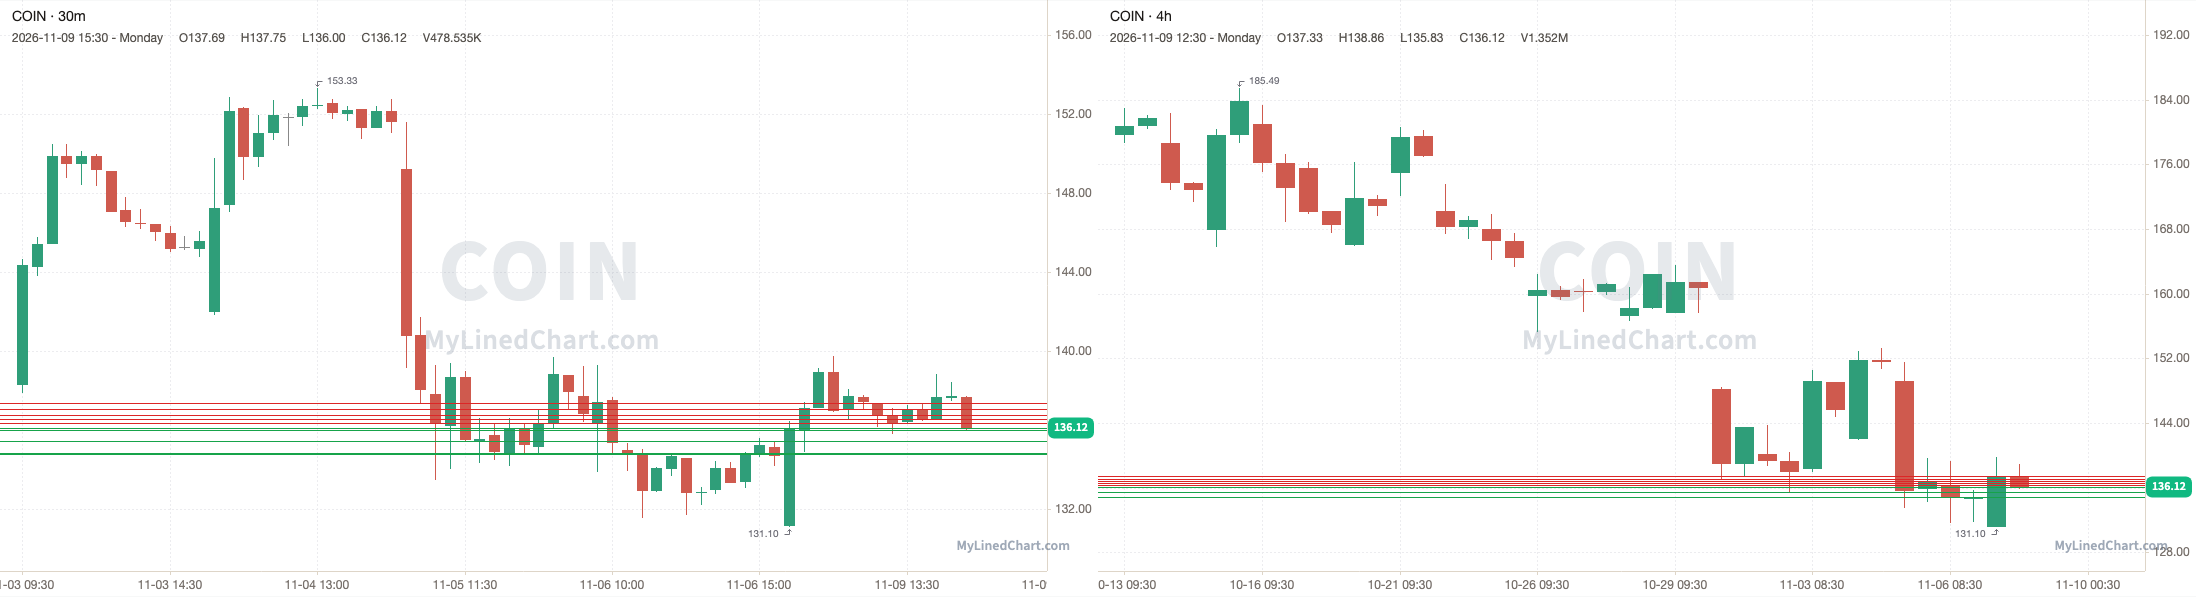
COIN (Coinbase)
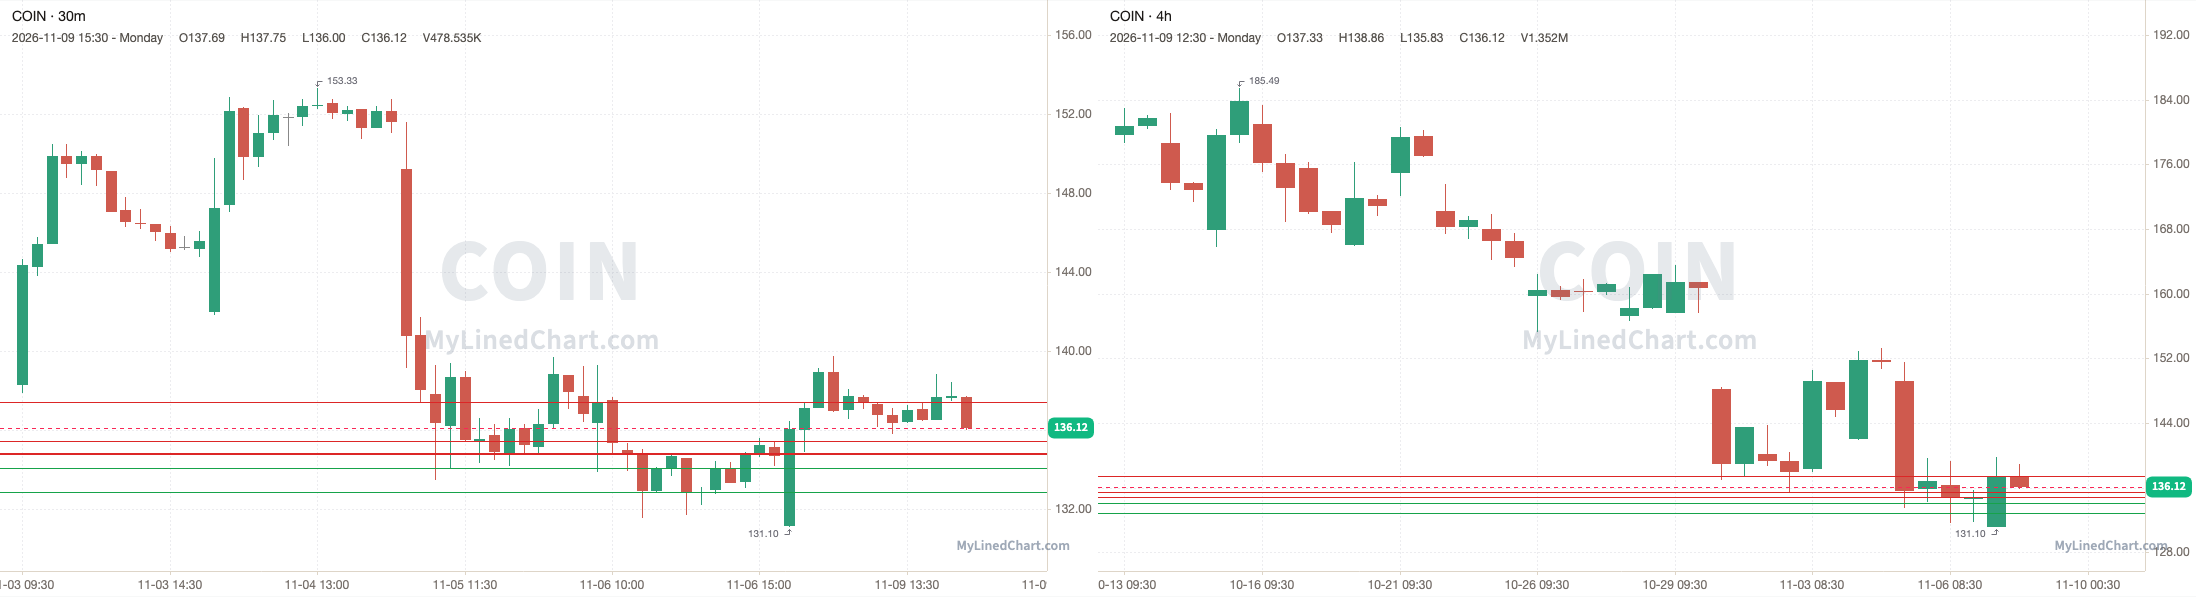
COIN opened at 131.13, broke above the 134.79 pivot and ran through every resistance level up to 137.42, and kept going to a high of 139.75, then ended up closing at 136.12. Finishing the trading session up 3.81% intraday and up 1.05% overall.
November 9th session levels:
All listed levels: 132.86, 134.08, 134.79, 134.87, 135.46, 137.42
Resistance above: 134.79, 134.87, 135.46, 137.42
Support below: 134.08, 132.86
Nearest pivot: 134.79
Above 134.79 → 134.87 next
Lose 134.08 → 132.86 next
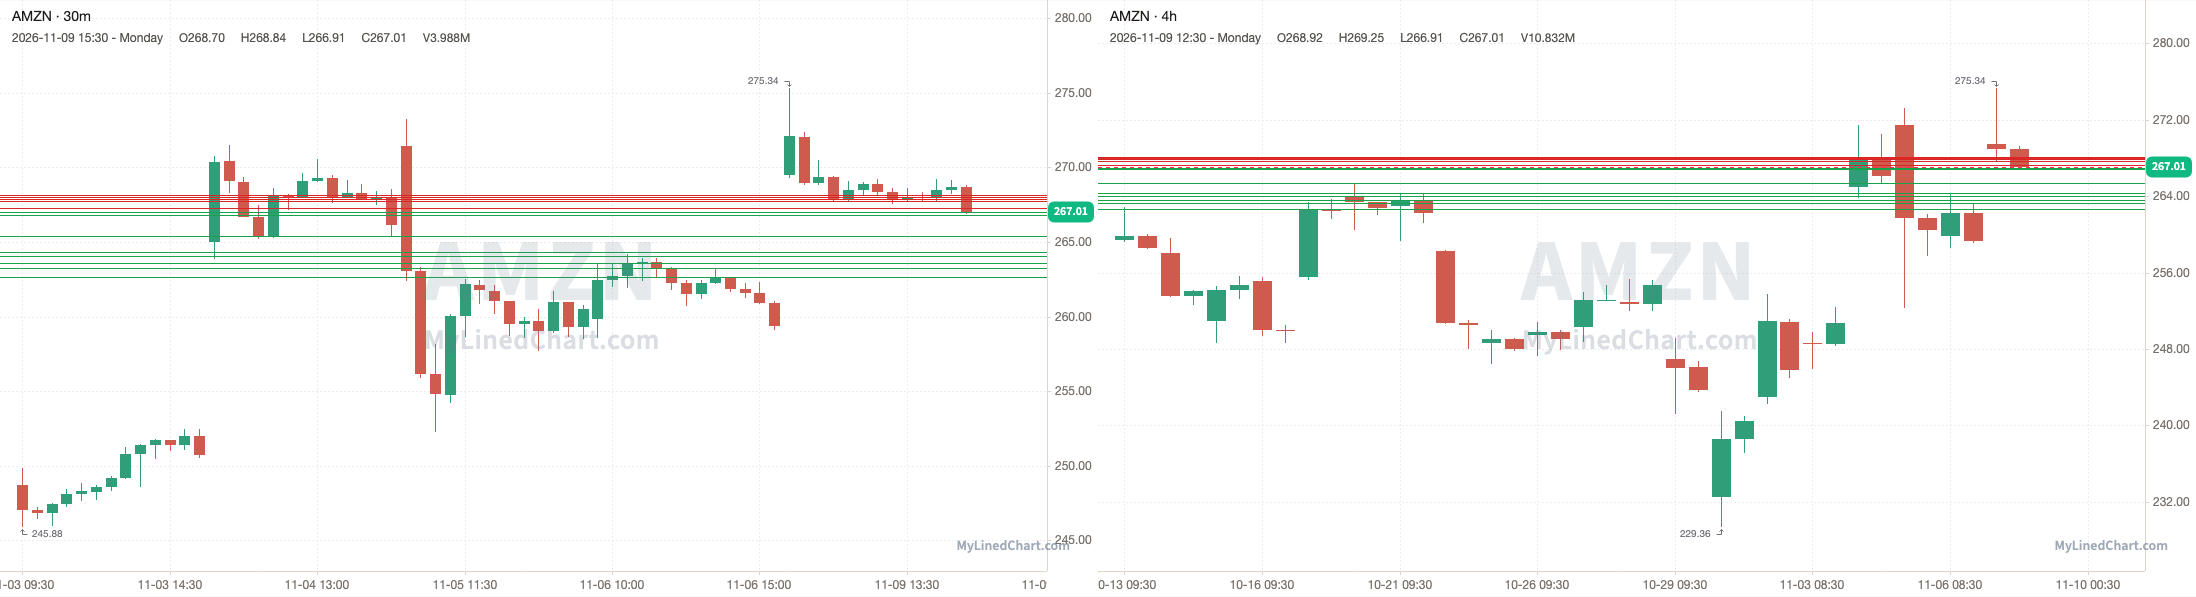
AMZN (Amazon)
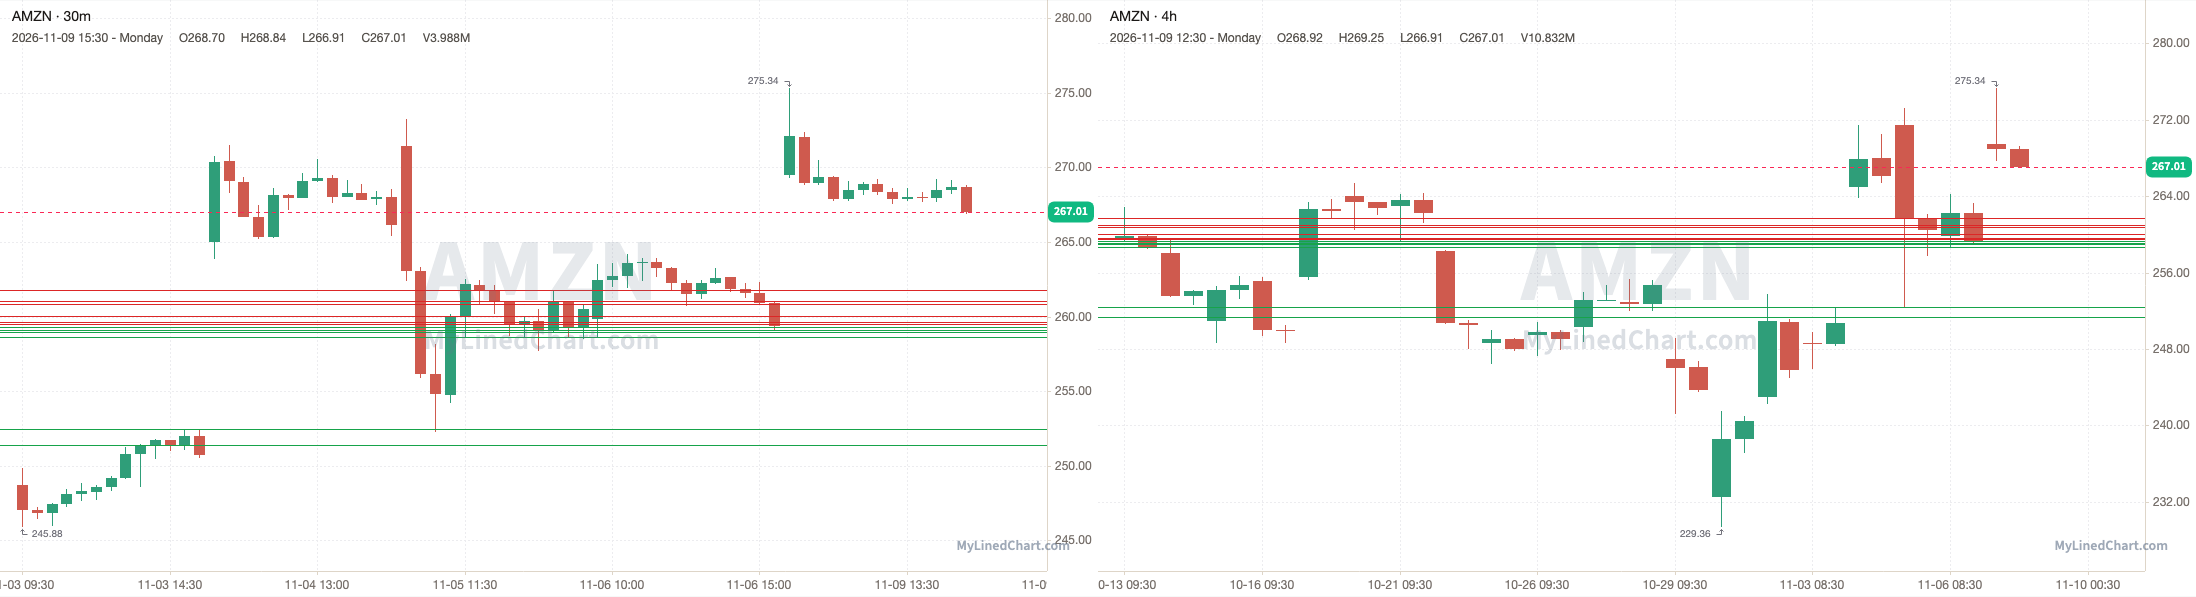
AMZN opened at 269.50, over the 259.32 pivot and every level in the plan, and never traded back down to them, with a high of 275.34 and a low of 266.91, then ended up closing at 267.01. Finishing the trading session down 0.92% intraday and up 2.95% overall.
November 9th session levels:
All listed levels: 251.39, 252.45, 258.66, 258.99, 259.08, 259.32, 259.52, 259.62, 260.01, 260.81, 261.02, 261.76
Resistance above: 259.52, 259.62, 260.01, 260.81, 261.02, 261.76
Support below: 259.32, 259.08, 258.99, 258.66, 252.45, 251.39
Nearest pivot: 259.32
Above 259.52 → 259.62 next
Lose 259.32 → 259.08 next
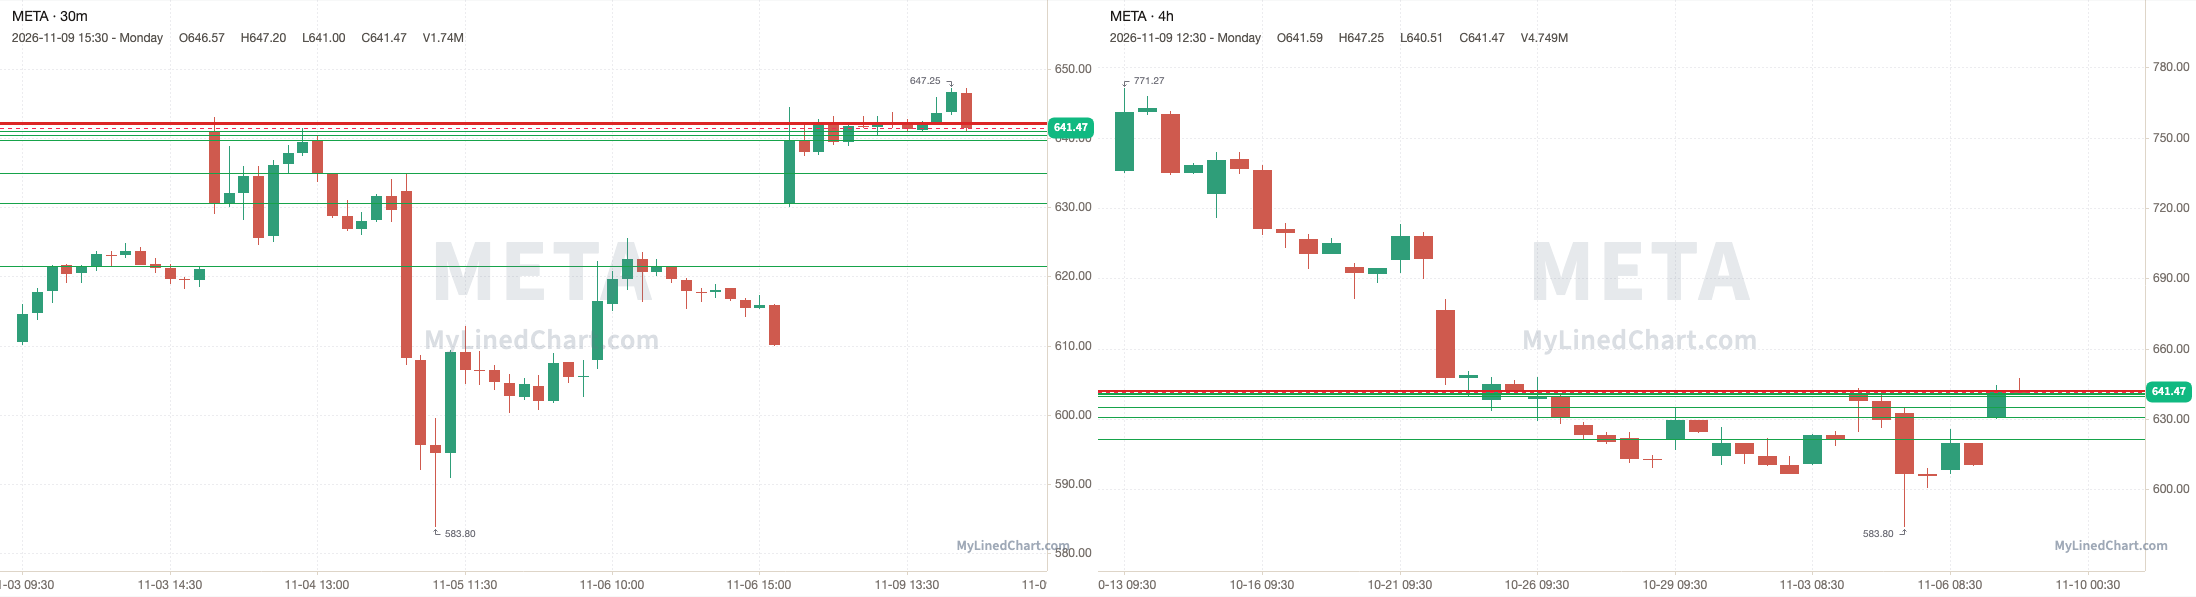
META (Meta Platforms)
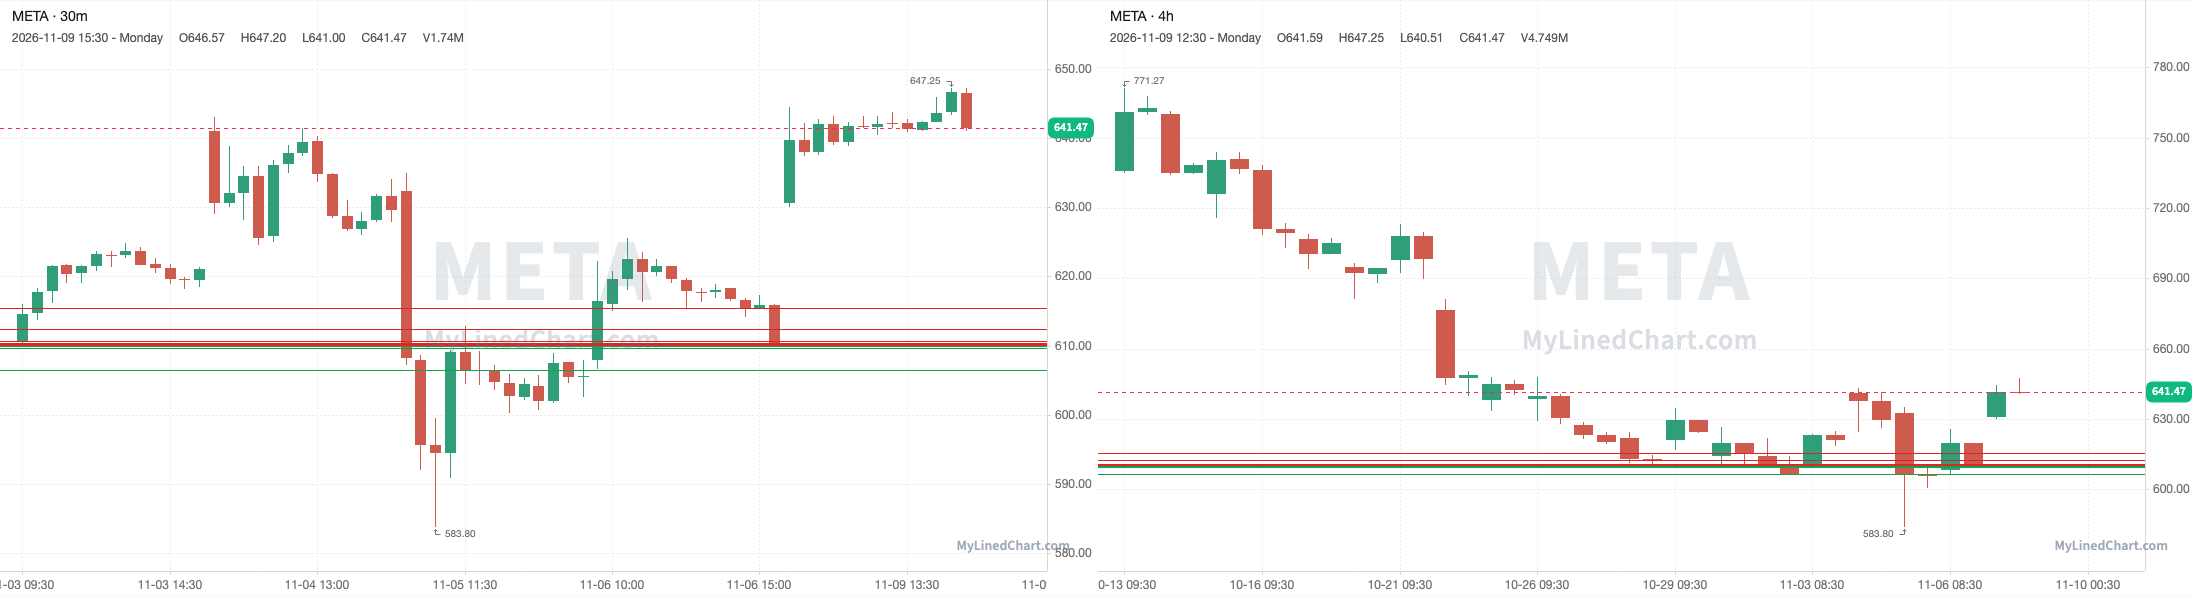
META opened at 630.62, over the 610.12 pivot and every level in the plan, and never traded back down to them, with a high of 647.25 and a low of 630, then ended up closing at 641.47. Finishing the trading session up 1.72% intraday and up 5.14% overall.
November 9th session levels:
All listed levels: 606.42, 609.62, 609.99, 610.12, 610.21, 610.38, 610.62, 612.40, 615.38
Resistance above: 610.21, 610.38, 610.62, 612.40, 615.38
Support below: 609.99, 609.62, 606.42
Nearest pivot: 610.12
Above 610.21 → 610.38 next
Lose 609.99 → 609.62 next
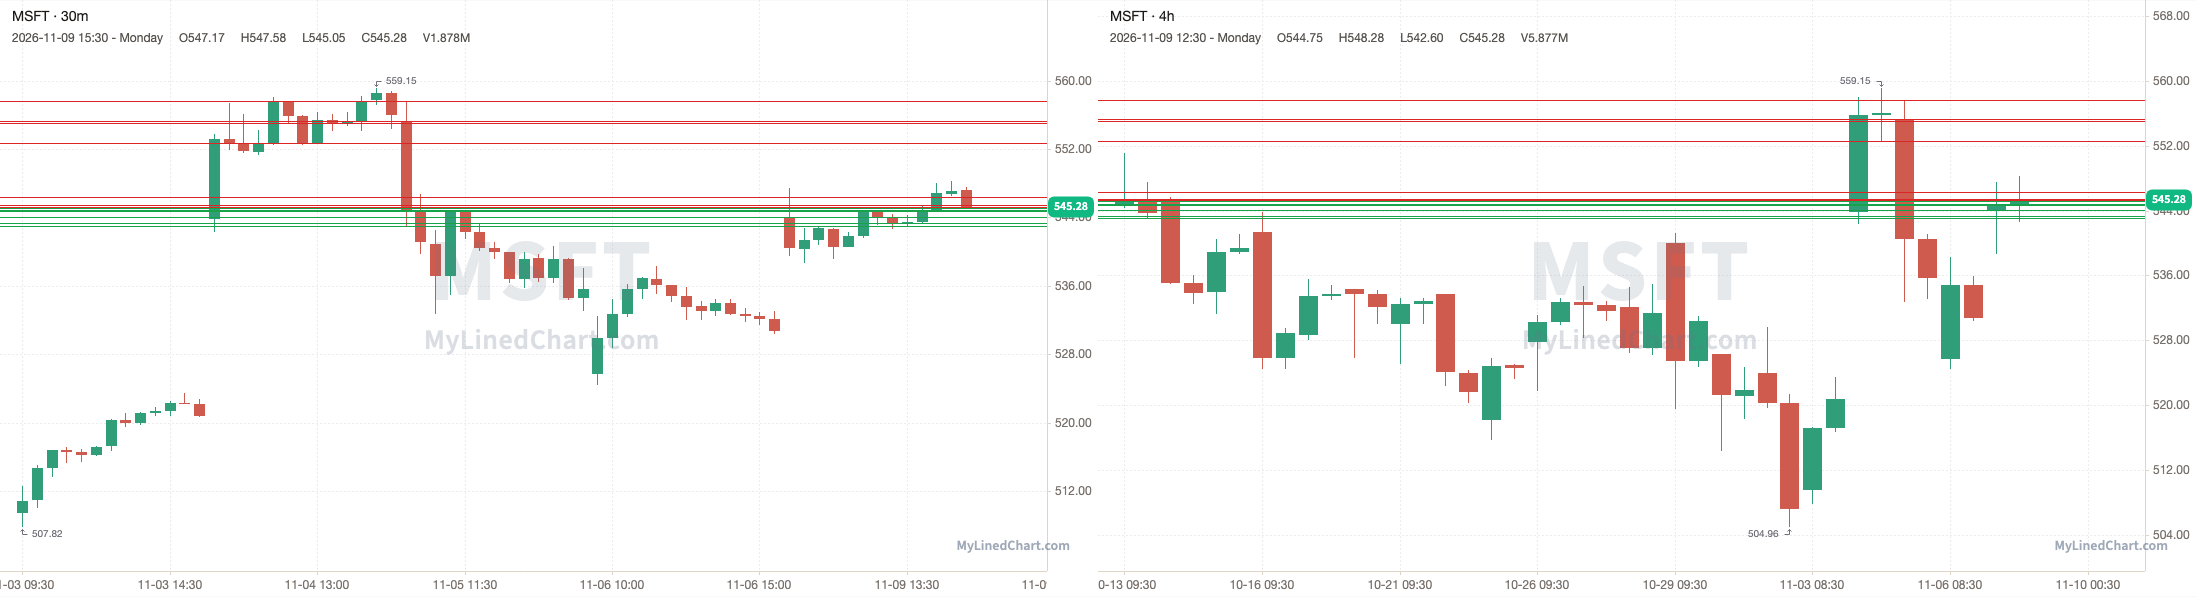
MSFT (Microsoft)
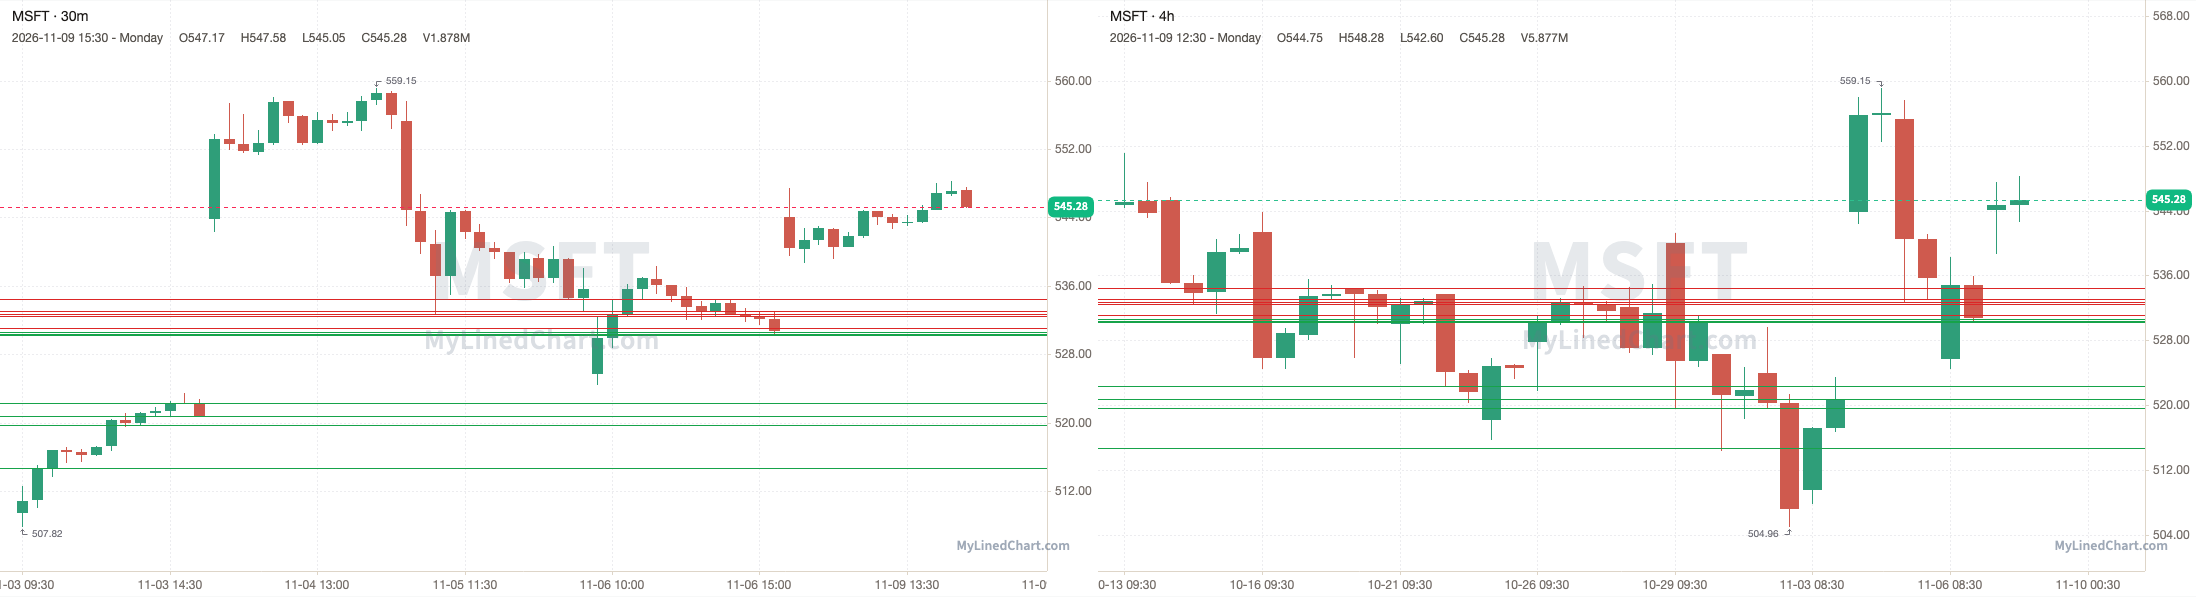
MSFT opened at 544.08, over the 530.64 pivot and every level in the plan, and never traded back down to them, with a high of 548.28 and a low of 538.69, then ended up closing at 545.28. Finishing the trading session up 0.22% intraday and up 2.74% overall.
November 9th session levels:
All listed levels: 514.73, 519.71, 520.77, 522.36, 530.21, 530.43, 530.64, 531.12, 532.46, 532.73, 533.06, 534.47
Resistance above: 531.12, 532.46, 532.73, 533.06, 534.47
Support below: 530.64, 530.43, 530.21, 522.36, 520.77, 519.71, 514.73
Nearest pivot: 530.64
Above 531.12 → 532.46 next
Lose 530.64 → 530.43 next
SMCI (Super Micro Computer)
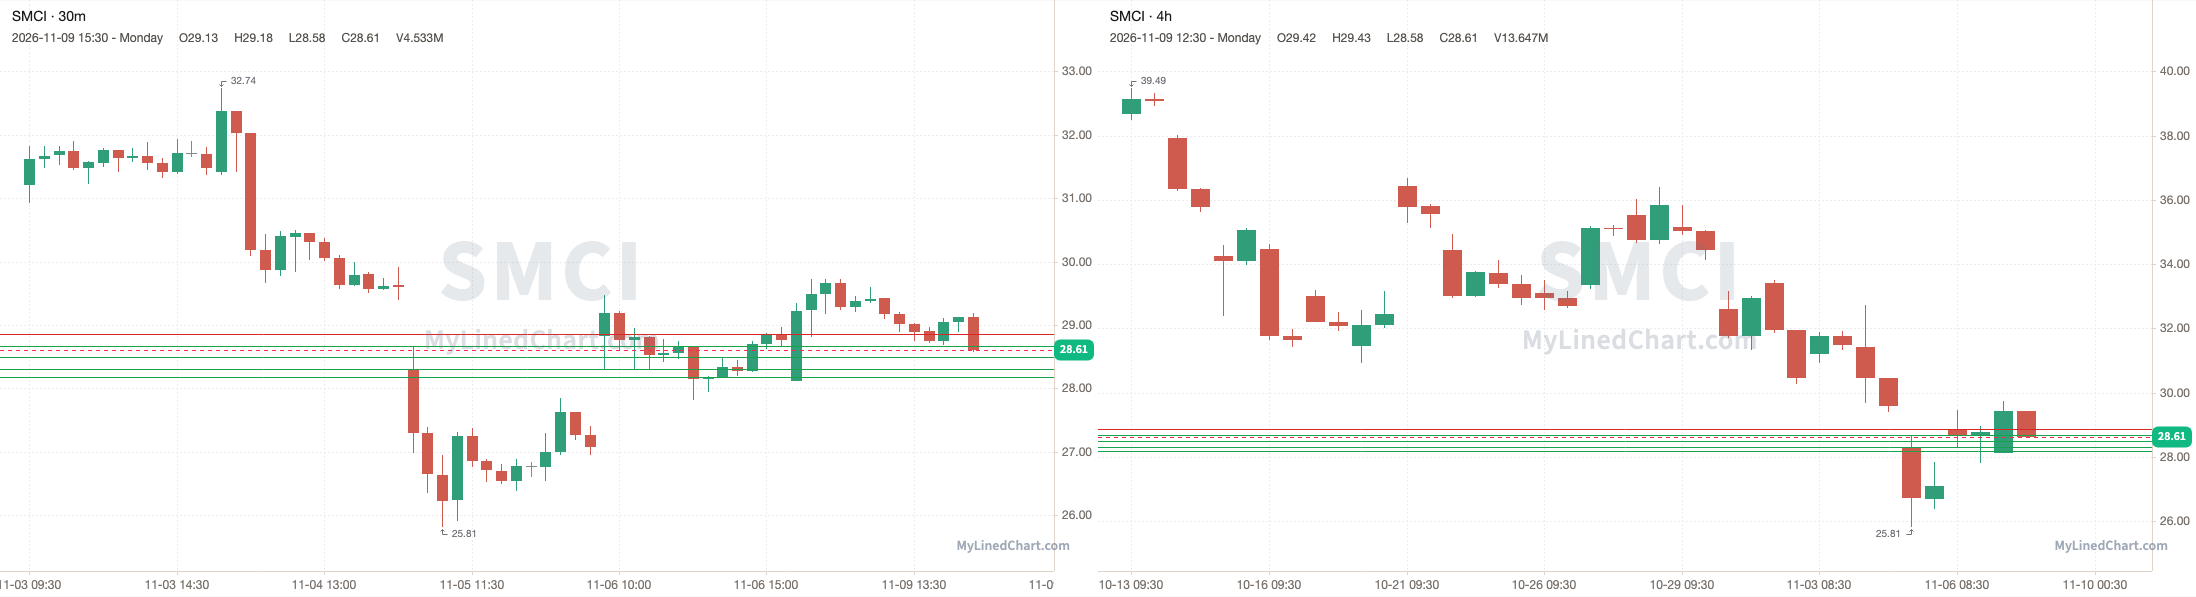
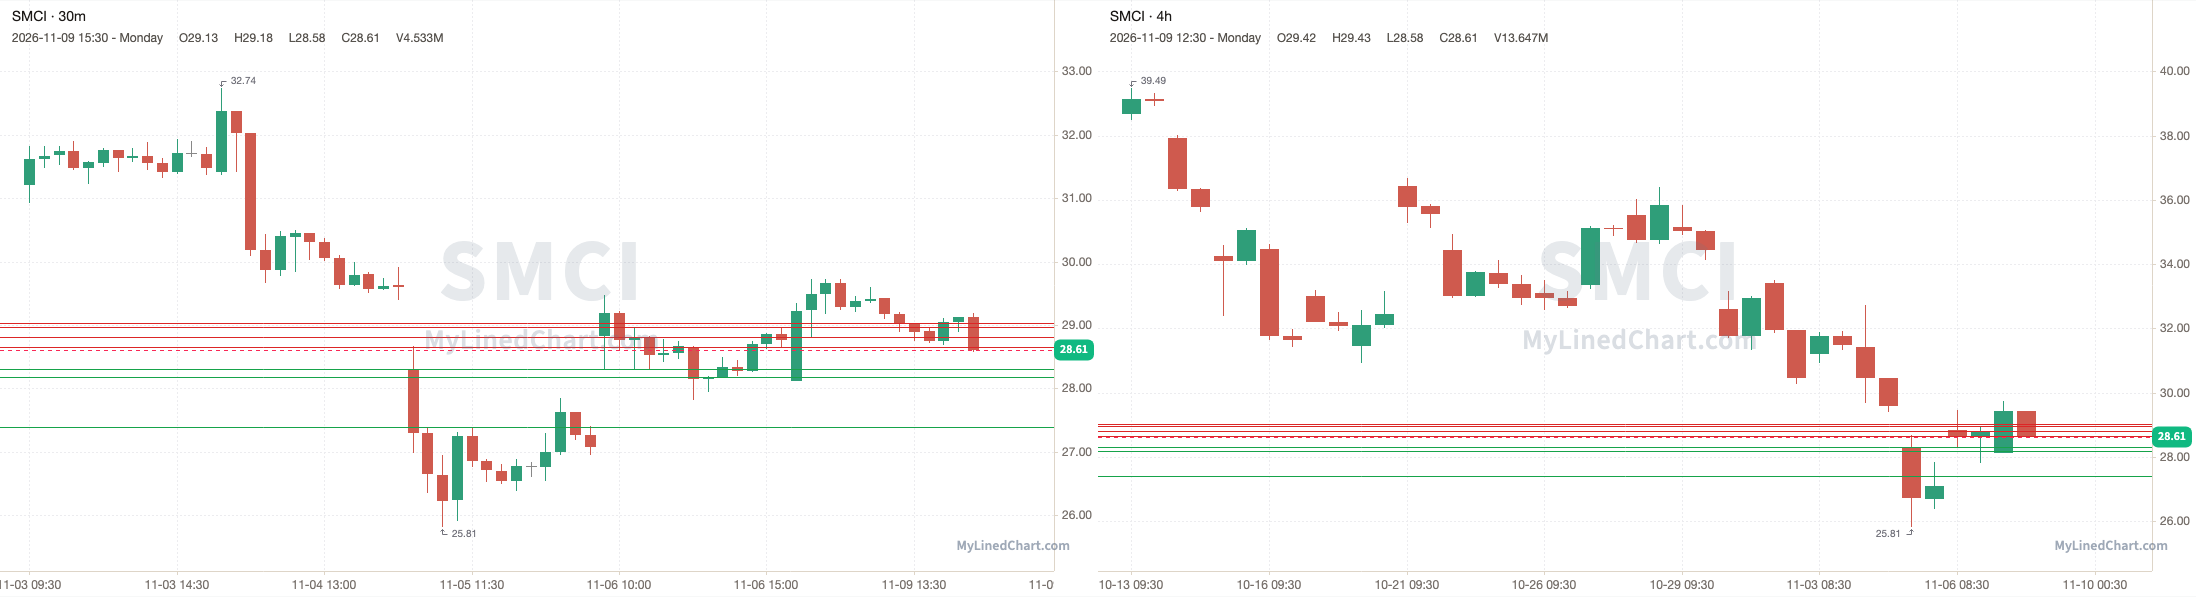
SMCI opened at 28.12, broke above the 28.67 pivot and ran through every resistance level up to 28.86, and kept going to a high of 29.73, then ended up closing at 28.61. Finishing the trading session up 1.74% intraday and down 0.52% overall.
November 9th session levels:
All listed levels: 28.17, 28.30, 28.50, 28.67, 28.86
Resistance above: 28.86
Support below: 28.67, 28.50, 28.30, 28.17
Nearest pivot: 28.67
Above 28.86 → open air
Lose 28.67 → 28.50 next
HOOD (Robinhood)
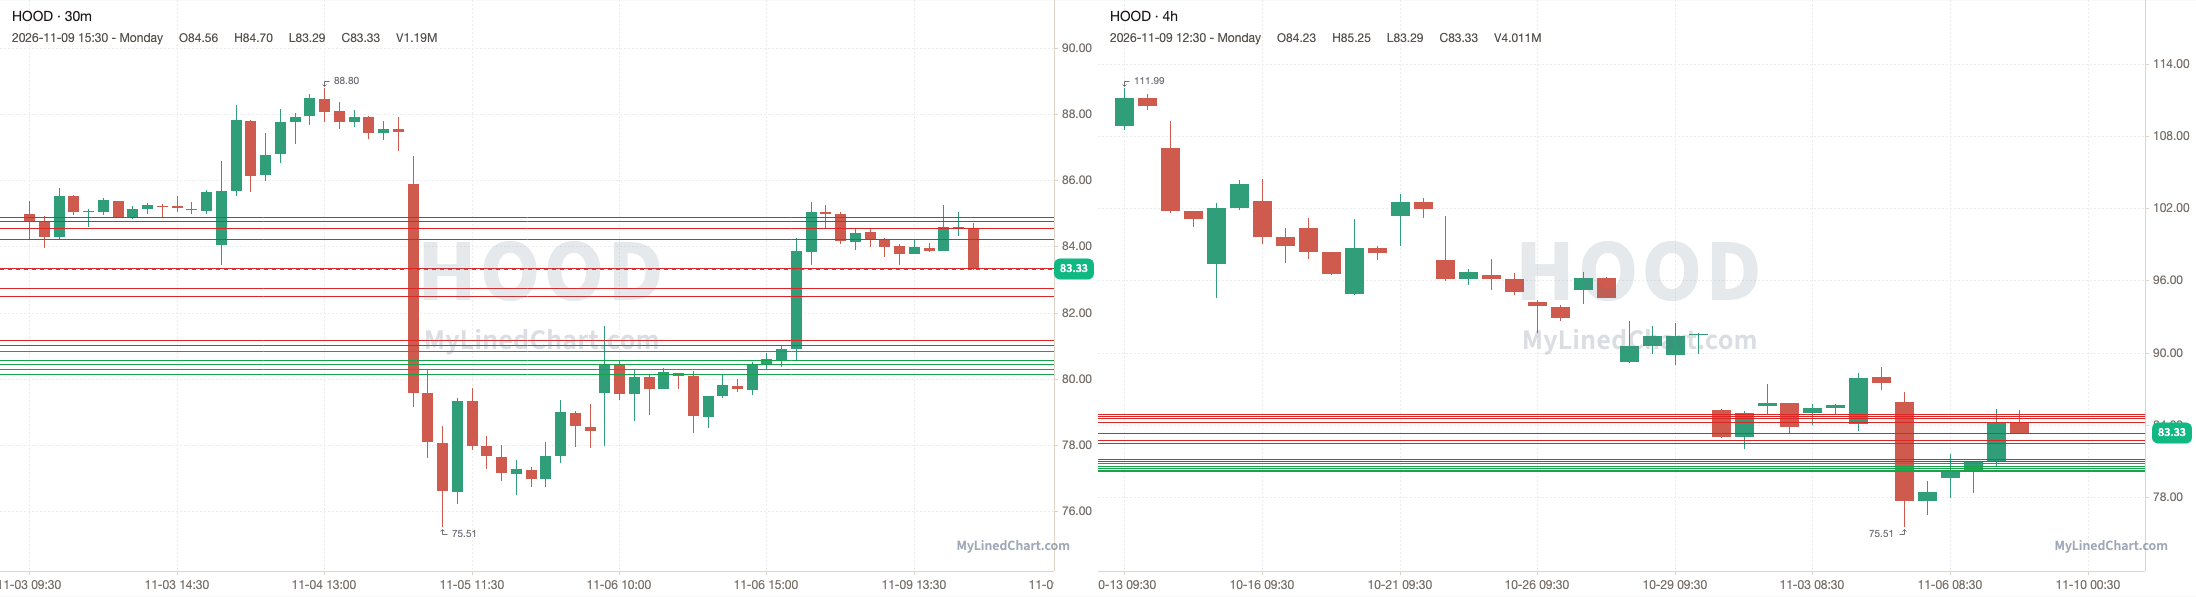
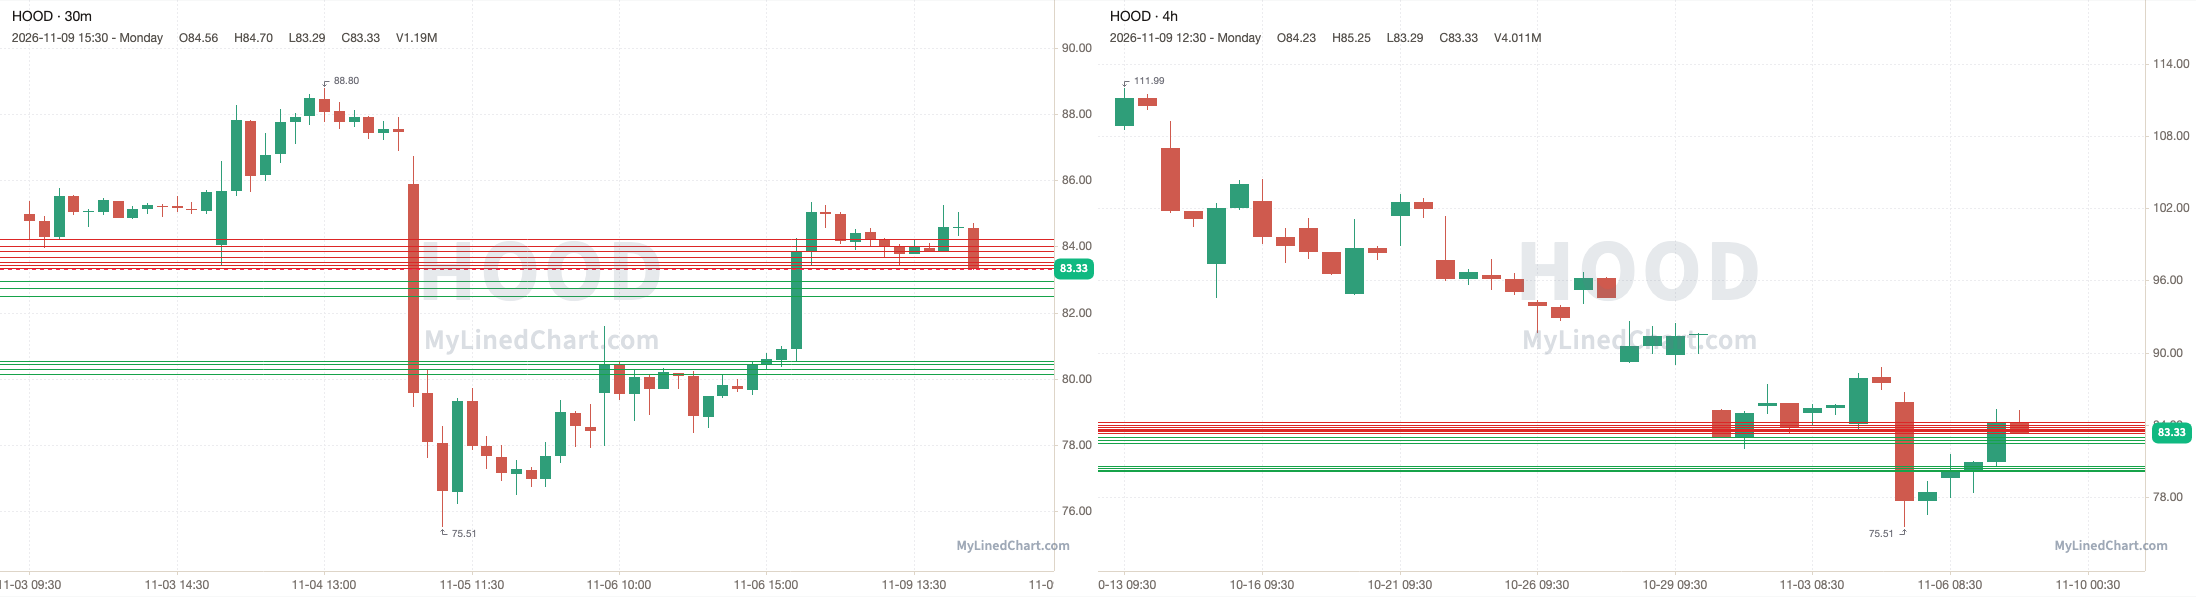
HOOD opened at 80.91, dipped below the 80.83 pivot to a low of 80.55, then reclaimed it and ran through every resistance level up to 84.88, and kept going to a high of 85.34, then ended up closing at 83.33. Finishing the trading session up 2.99% intraday and up 3.00% overall.
November 9th session levels:
All listed levels: 80.14, 80.29, 80.44, 80.56, 80.83, 81.01, 81.16, 82.50, 82.74, 83.36, 84.24, 84.57, 84.77, 84.88
Resistance above: 81.01, 81.16, 82.50, 82.74, 83.36, 84.24, 84.57, 84.77, 84.88
Support below: 80.83, 80.56, 80.44, 80.29, 80.14
Nearest pivot: 80.83
Above 81.01 → 81.16 next
Lose 80.83 → 80.56 next
MARA (MARA Holdings)
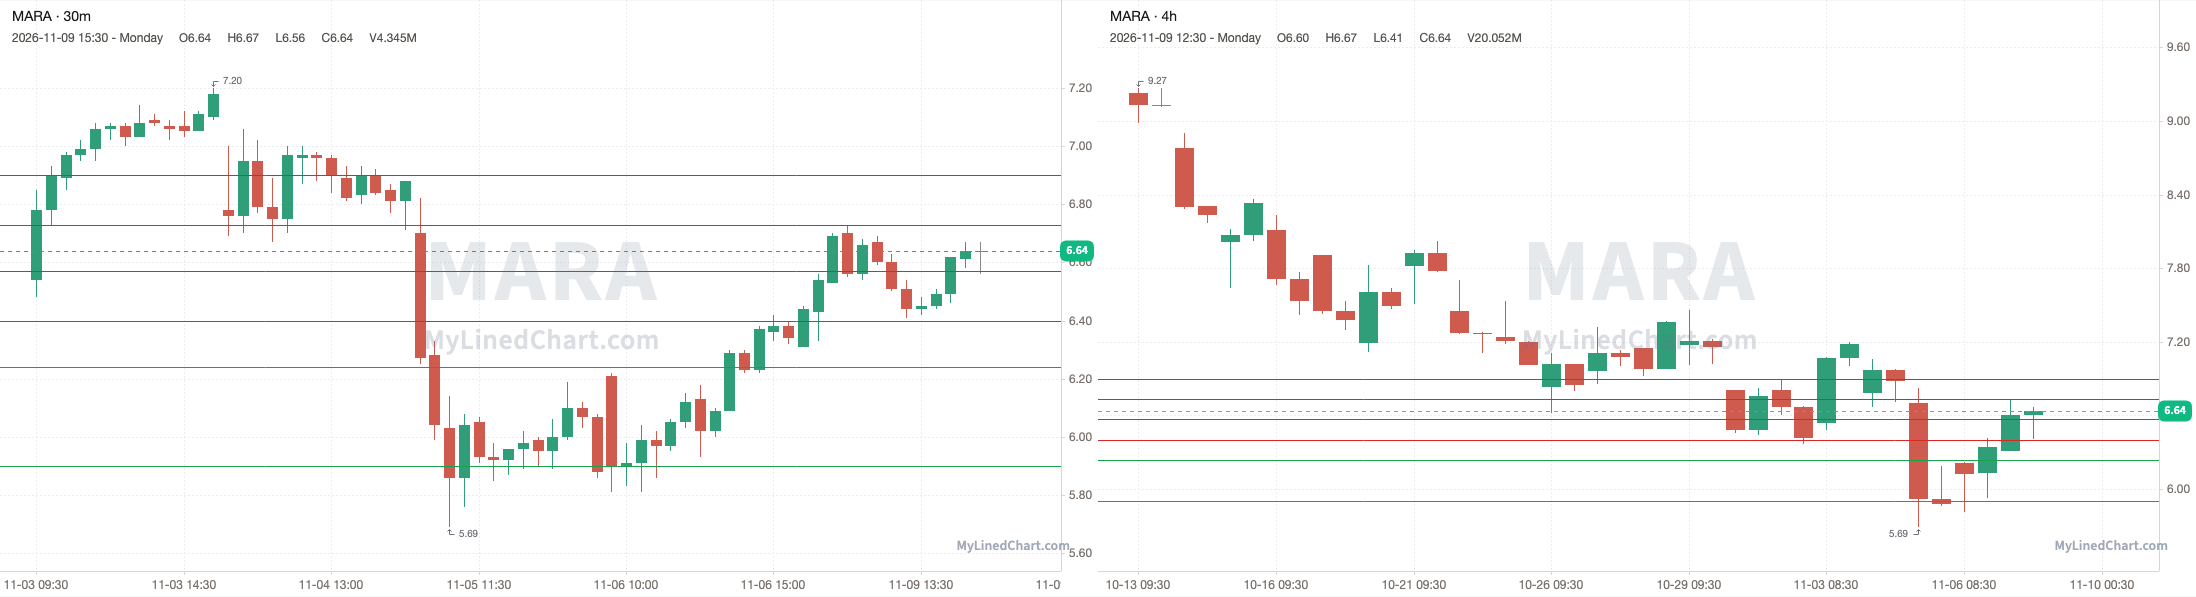
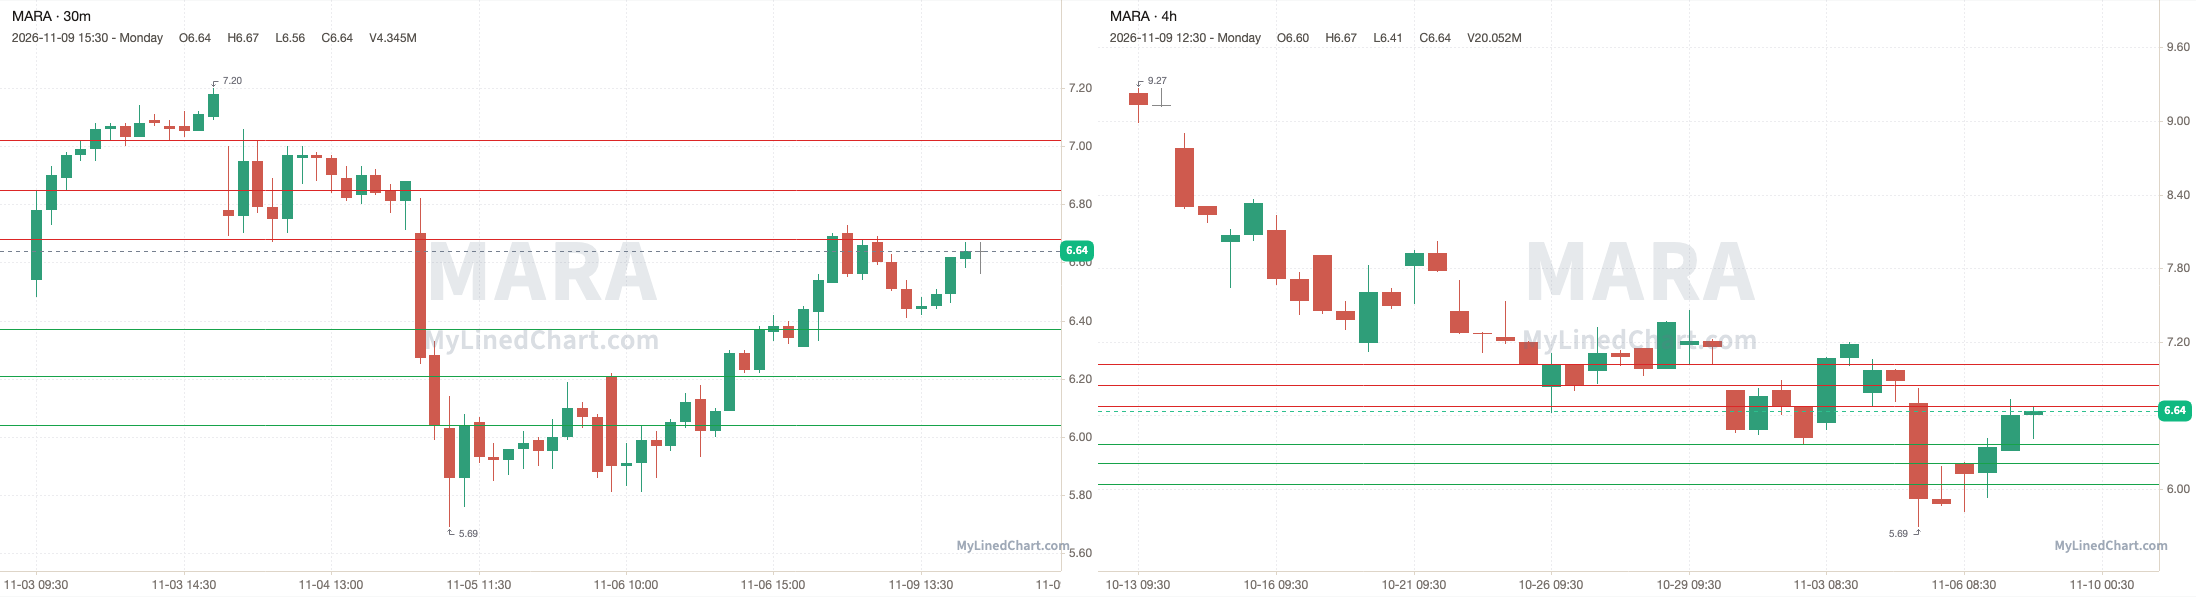
MARA opened at 6.31, broke above the 6.40 pivot and ran up to tag 6.73, with a high of 6.73, then ended up closing at 6.64. Finishing the trading session up 5.23% intraday and up 4.57% overall.
November 9th session levels:
All listed levels: 5.90, 6.24, 6.40, 6.57, 6.73, 6.90
Resistance above: 6.40, 6.57, 6.73, 6.90
Support below: 6.24, 5.90
Nearest pivot: 6.40
Above 6.40 → 6.57 next
Lose 6.24 → 5.90 next
GME (GameStop)
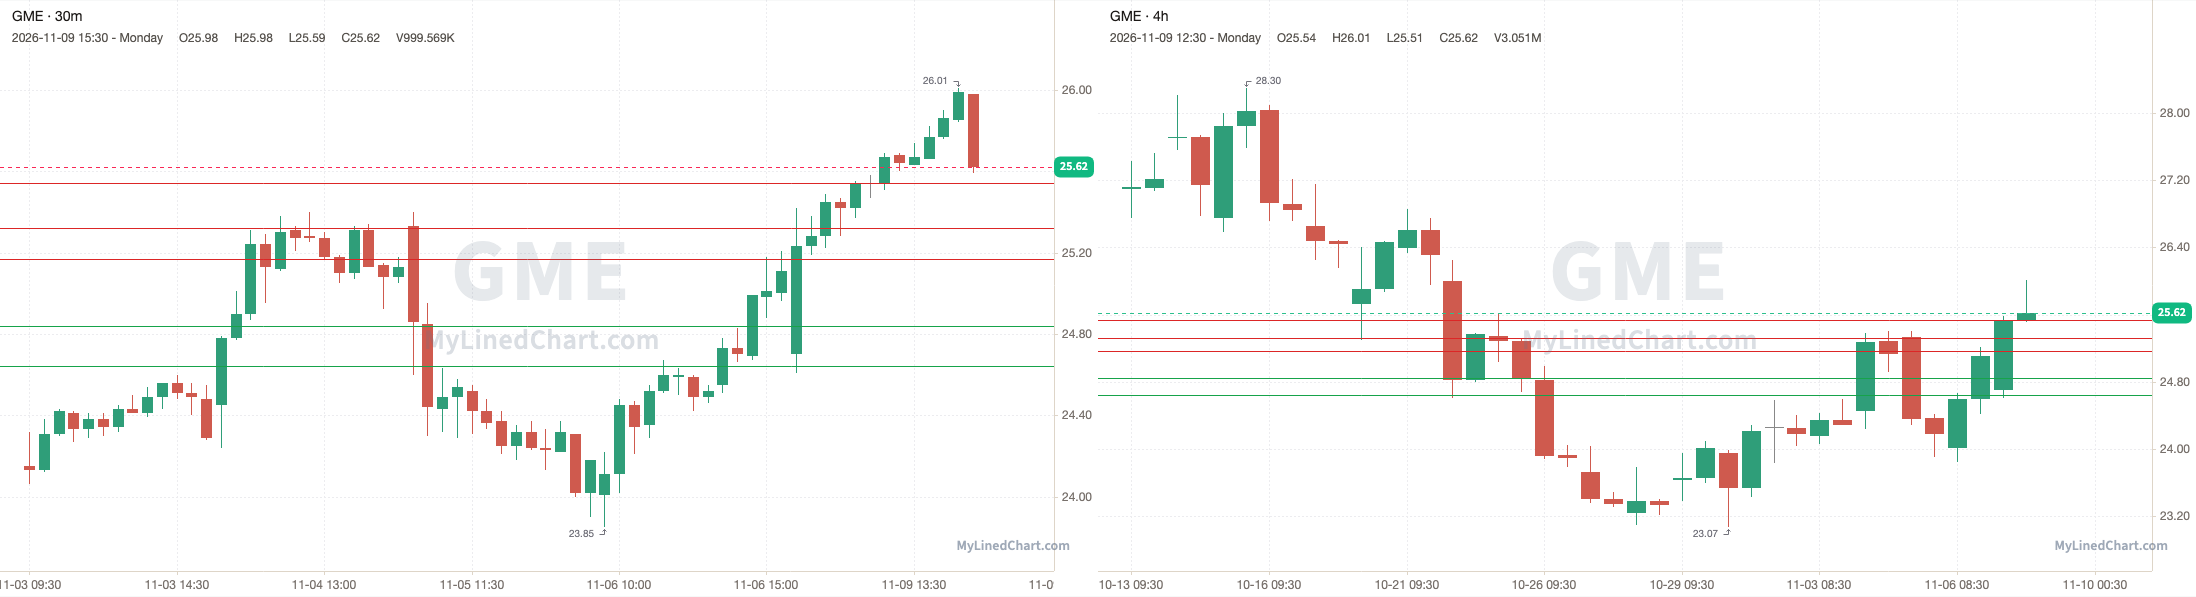
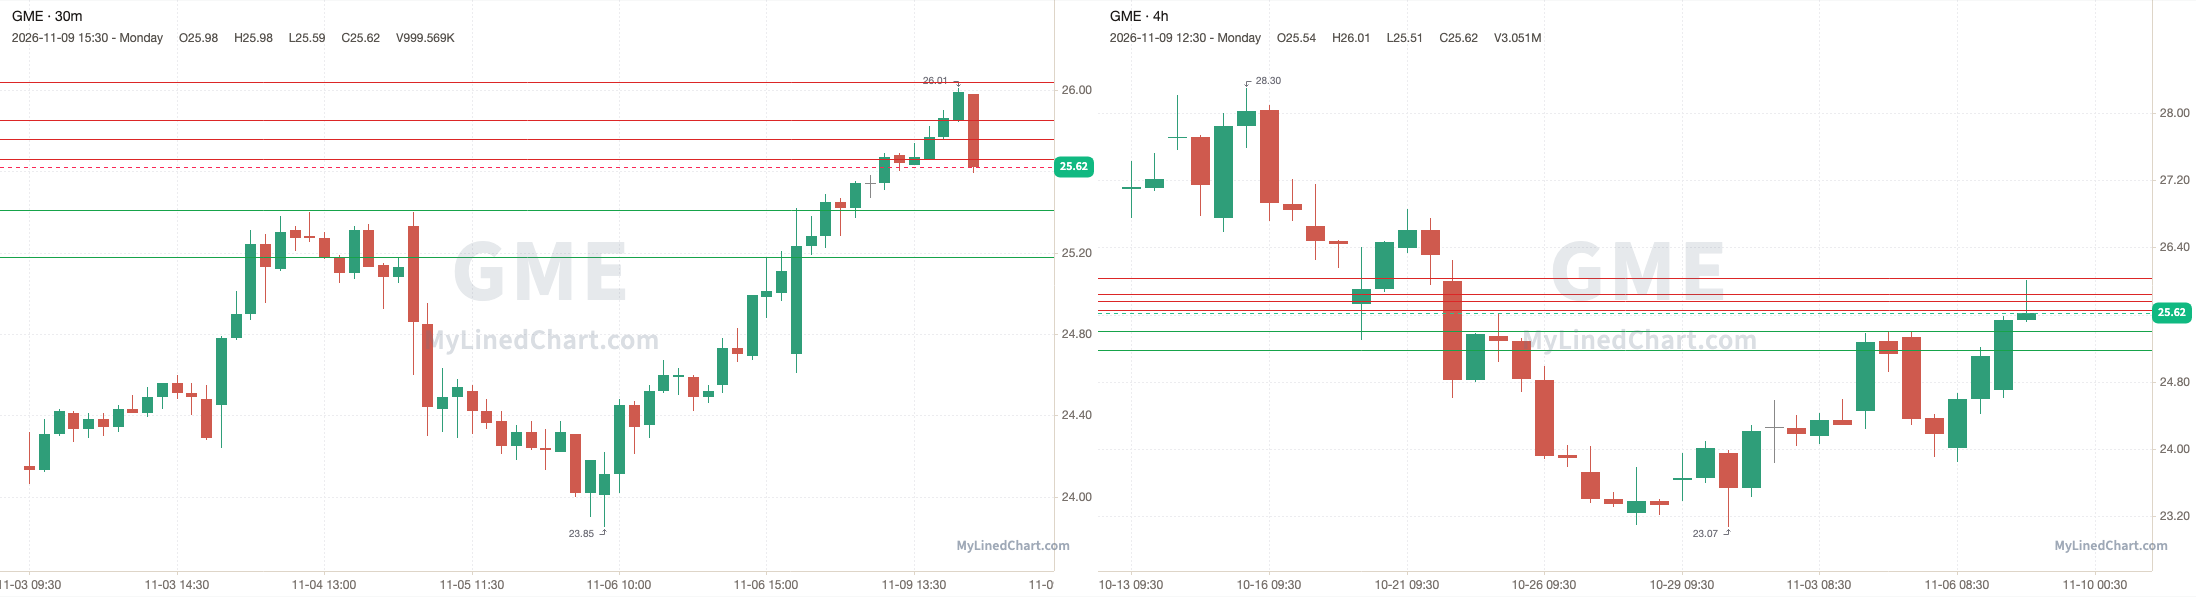
GME opened at 24.70, broke above the 25.17 pivot and ran through every resistance level up to 25.54, and kept going to a high of 26.01, then ended up closing at 25.62. Finishing the trading session up 3.72% intraday and up 2.03% overall.
November 9th session levels:
All listed levels: 24.64, 24.84, 25.17, 25.32, 25.54
Resistance above: 25.17, 25.32, 25.54
Support below: 24.84, 24.64
Nearest pivot: 25.17
Above 25.17 → 25.32 next
Lose 24.84 → 24.64 next
IBIT (iShares Bitcoin Trust)
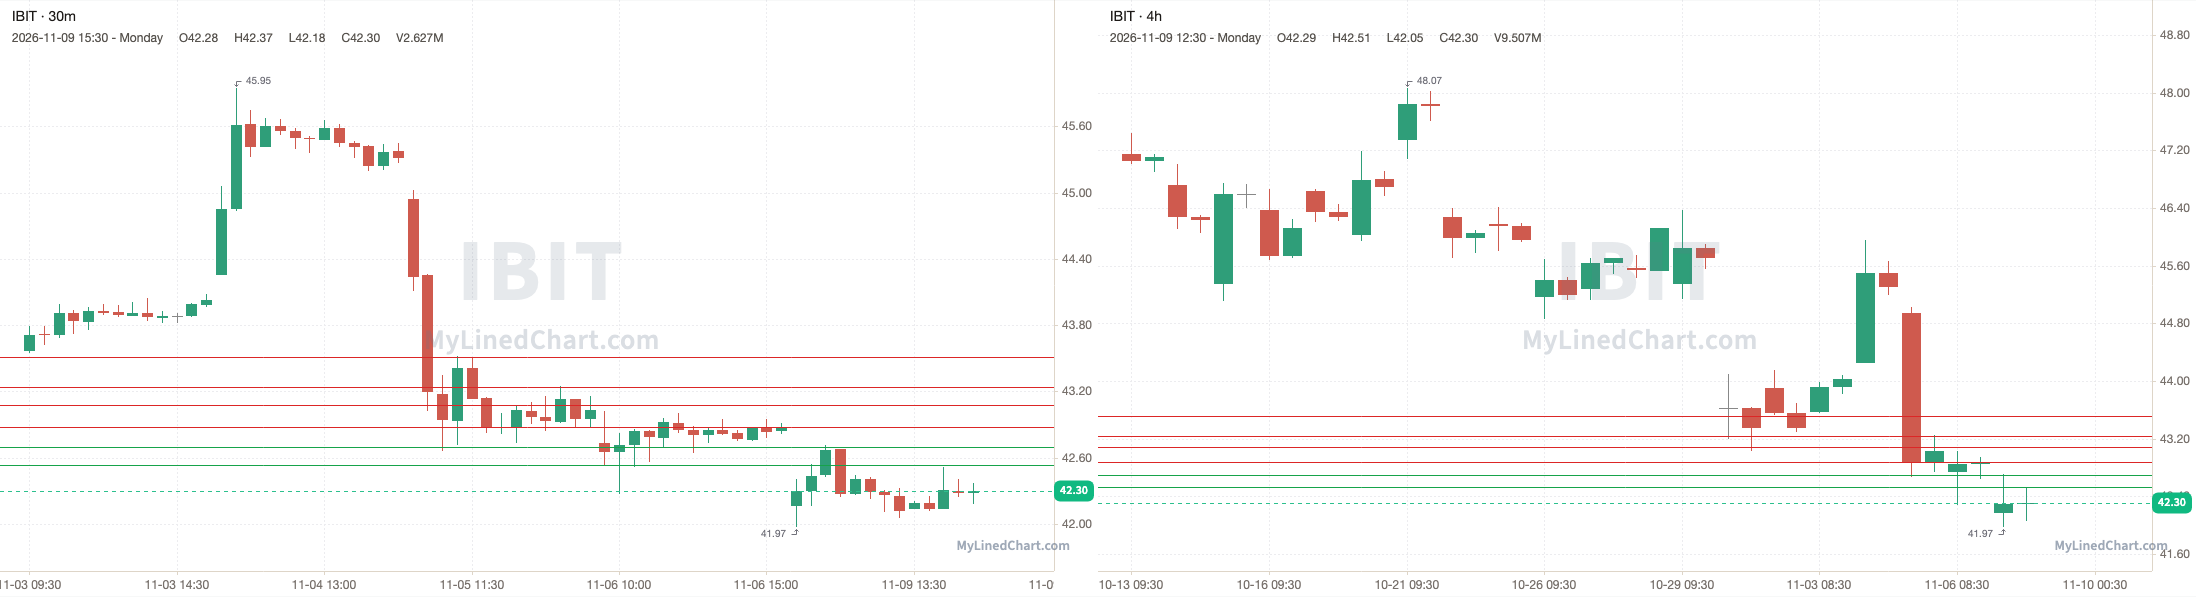
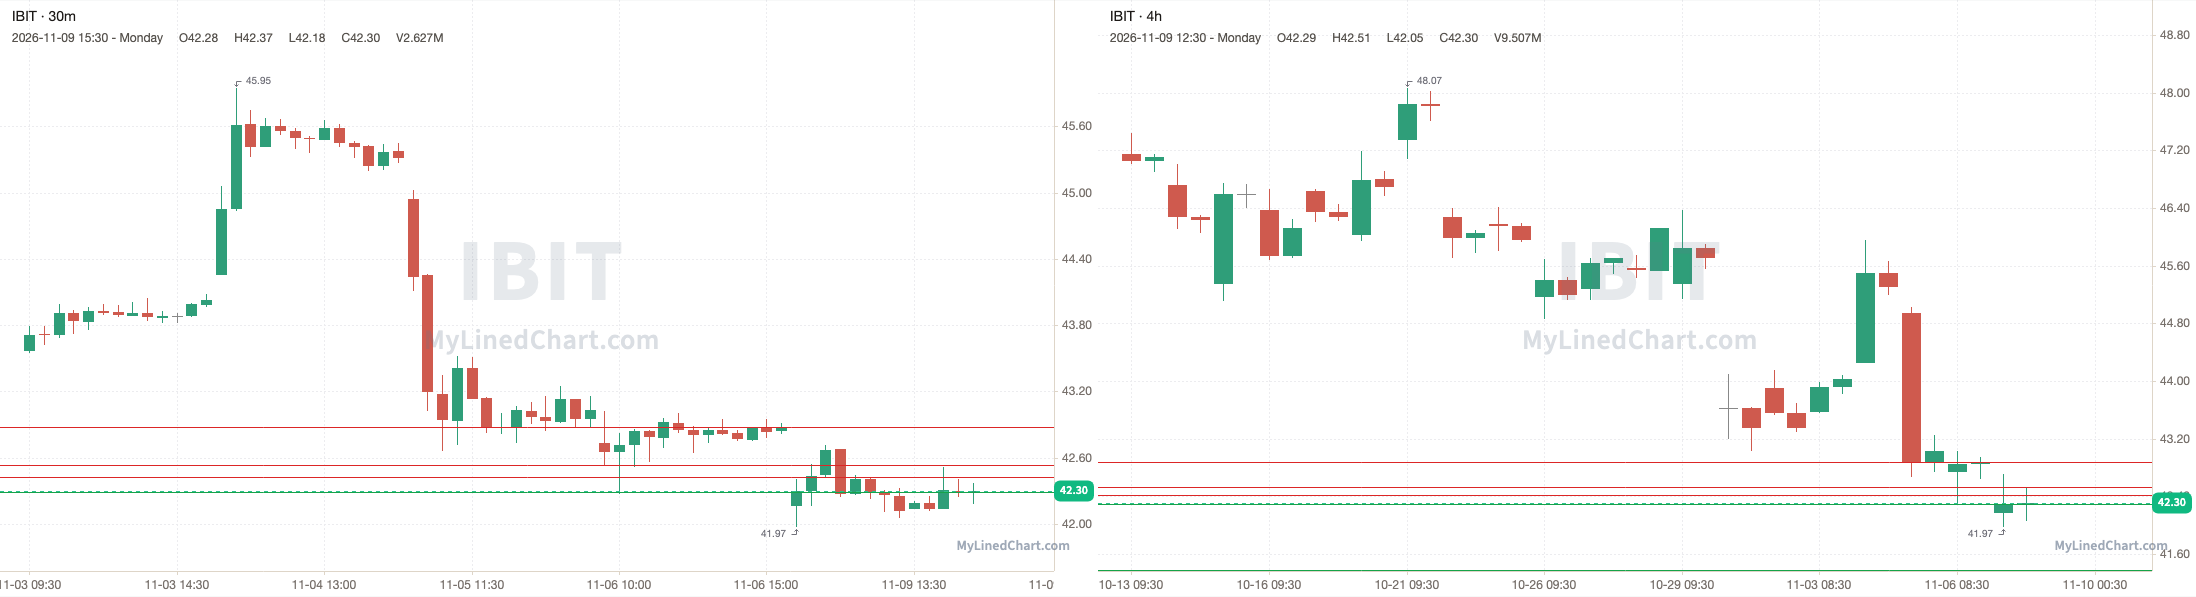
IBIT opened at 42.16, stayed under the 42.88 pivot and pushed to a high of 42.71, then ended up closing at 42.30. Finishing the trading session up 0.33% intraday and down 1.33% overall.
November 9th session levels:
All listed levels: 42.53, 42.70, 42.88, 43.08, 43.24, 43.51
Resistance above: 42.88, 43.08, 43.24, 43.51
Support below: 42.70, 42.53
Nearest pivot: 42.88
Above 42.88 → 43.08 next
Lose 42.70 → 42.53 next
ETHA (iShares Ethereum Trust)
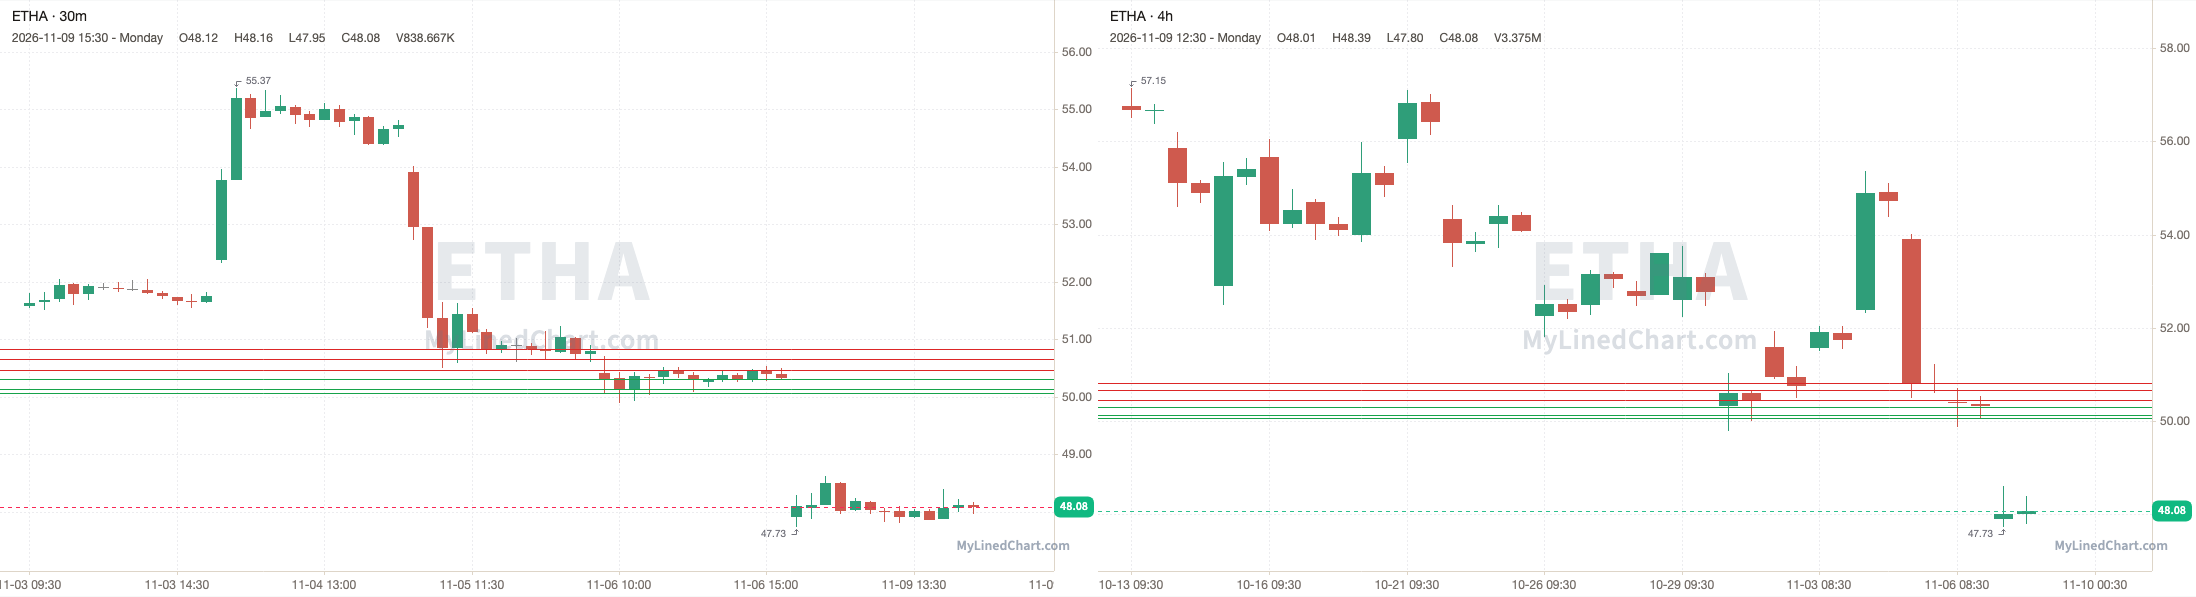
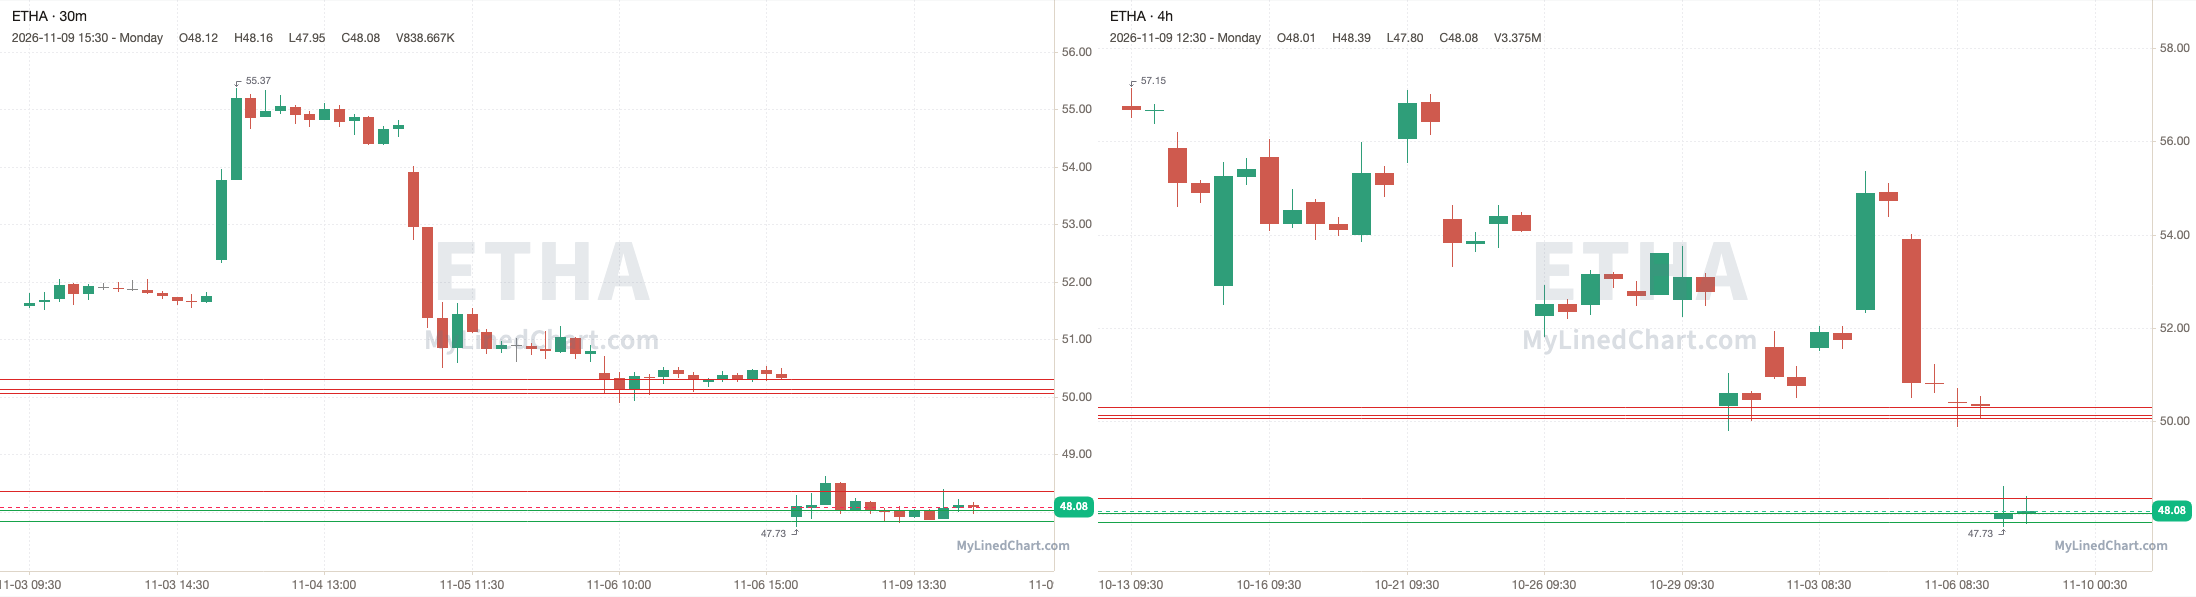
ETHA opened at 47.91, under the 50.30 pivot and every level in the plan, and never traded back up to them, with a high of 48.61 and a low of 47.73, then ended up closing at 48.08. Finishing the trading session up 0.35% intraday and down 4.45% overall.
November 9th session levels:
All listed levels: 50.06, 50.14, 50.30, 50.46, 50.66, 50.82
Resistance above: 50.46, 50.66, 50.82
Support below: 50.30, 50.14, 50.06
Nearest pivot: 50.30
Above 50.46 → 50.66 next
Lose 50.30 → 50.14 next
INTC (Intel)
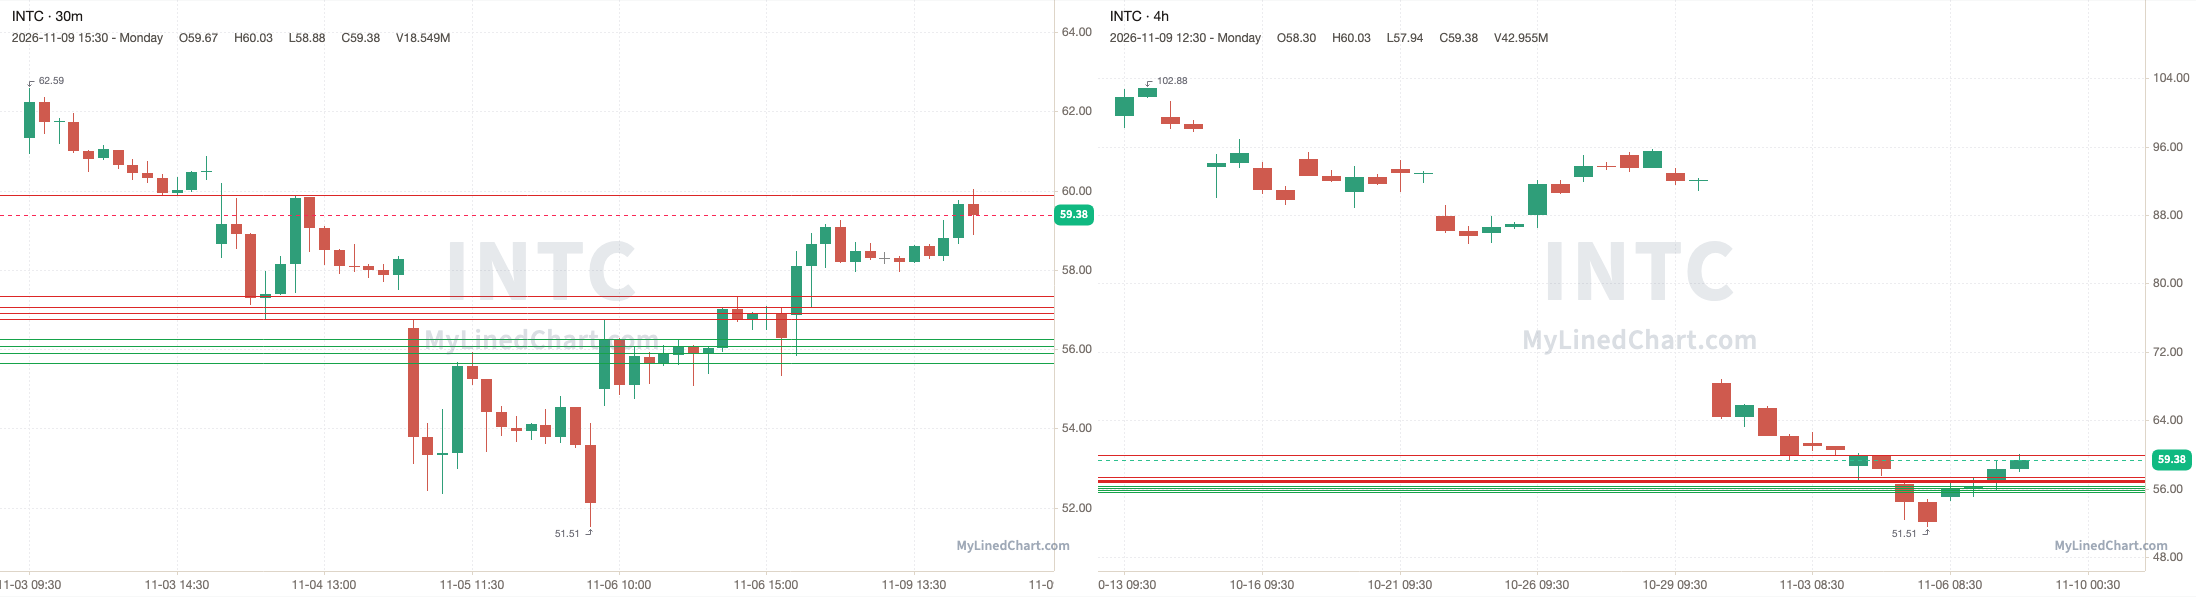
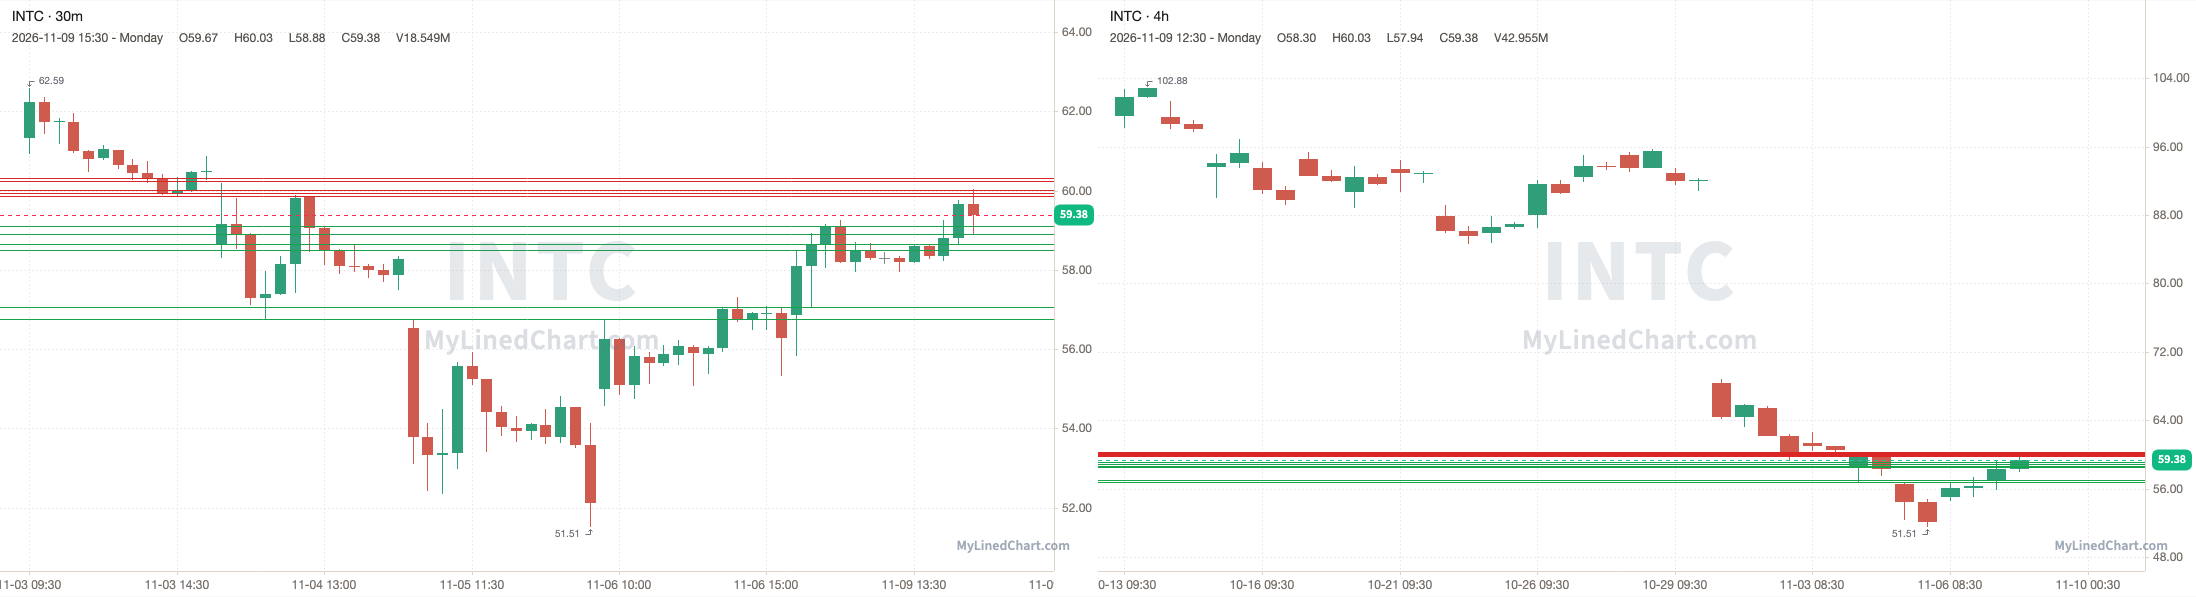
INTC opened at 56.86, dipped below the 56.26 pivot to a low of 55.83, then reclaimed it and ran up to tag 59.89, with a high of 60.03, then ended up closing at 59.38. Finishing the trading session up 4.43% intraday and up 5.49% overall.
November 9th session levels:
All listed levels: 55.66, 55.90, 56.08, 56.26, 56.75, 56.92, 57.05, 57.35, 59.89
Resistance above: 56.75, 56.92, 57.05, 57.35, 59.89
Support below: 56.26, 56.08, 55.90, 55.66
Nearest pivot: 56.26
Above 56.75 → 56.92 next
Lose 56.26 → 56.08 next
RIVN (Rivian)
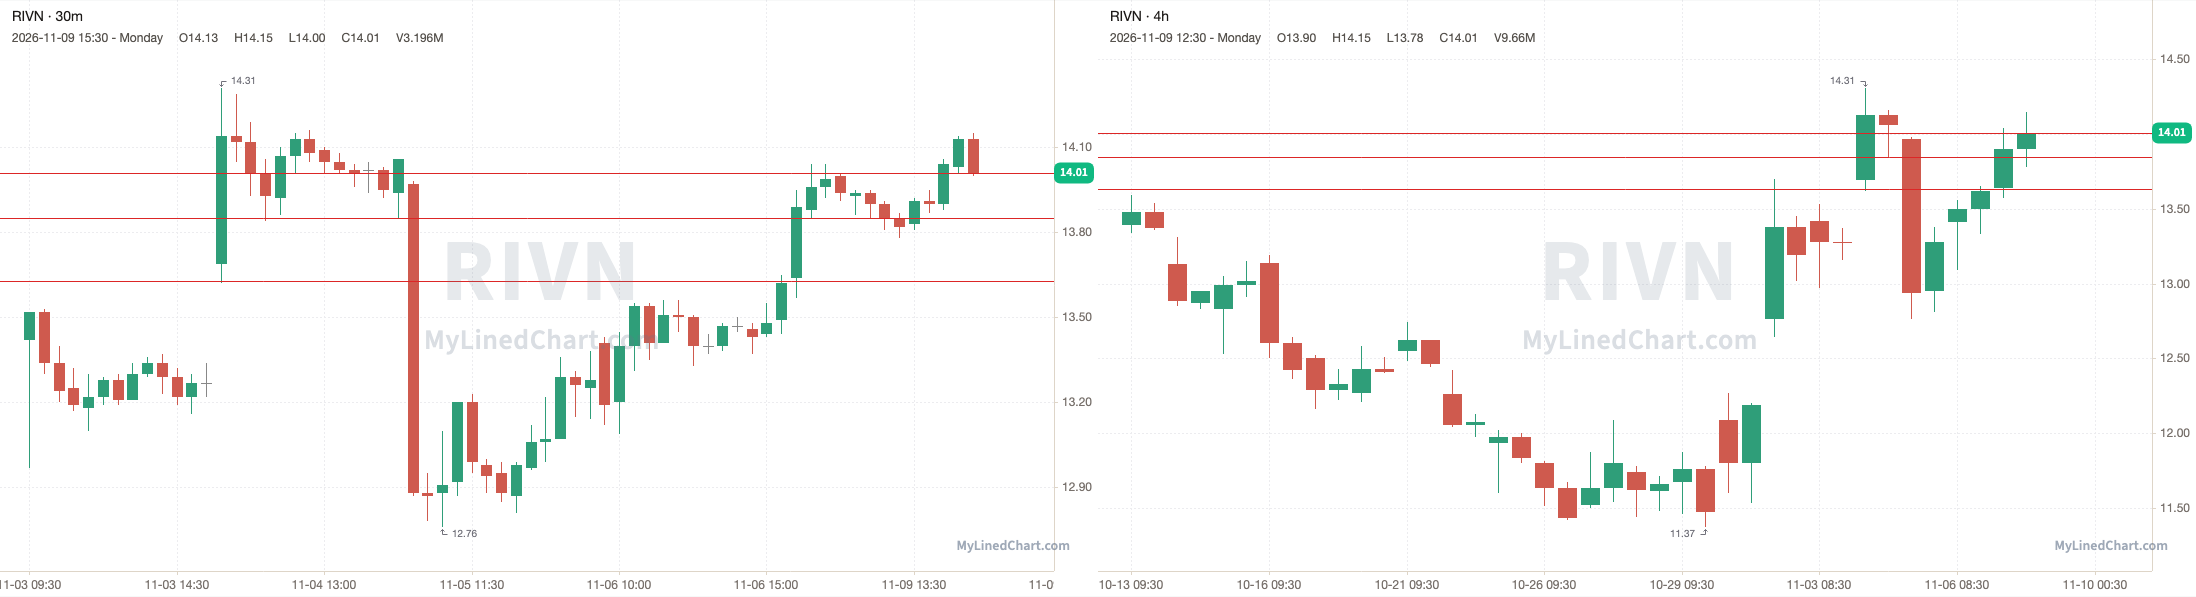
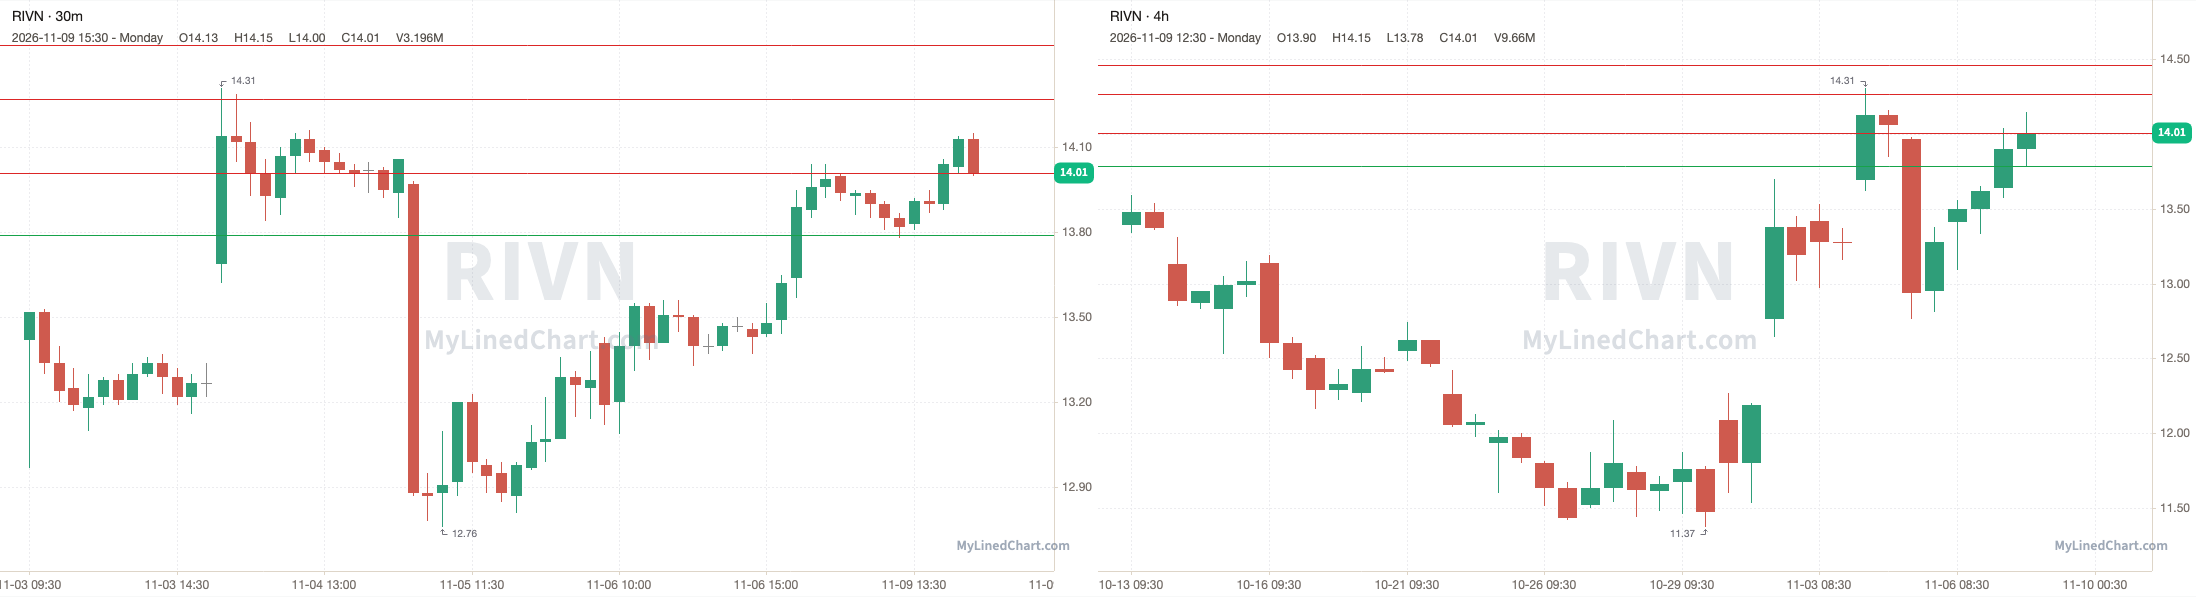
RIVN opened at 13.64, dipped below the 13.63 pivot to a low of 13.57, then reclaimed it and ran through every resistance level up to 14.01, and kept going to a high of 14.15, then ended up closing at 14.01. Finishing the trading session up 2.71% intraday and up 2.86% overall.
November 9th session levels:
All listed levels: 13.63, 13.85, 14.01
Resistance above: 13.63, 13.85, 14.01
Support below: none
Nearest pivot: 13.63
Above 13.63 → 13.85 next
Day Trade Levels for the November 10th Trading Session:
Day-trade levels for November 10th
BTC and ETH use normal US market hours, 9:30 AM to 4:00 PM ET.
NVDA (NVIDIA)
Nearest pivot: 177.20
Above 182.31 → 183.61 next
Above 183.61 → 184.43 next
Above 184.43 → 186.24 next
Above 186.24 → 192.36 next
Above 192.36 → 192.56 next
Above 192.56 → open air
Lose 177.20 → 176.78 next
Lose 176.78 → 175.80 next
Lose 175.80 → open air
TSLA (Tesla)
Nearest pivot: 379.09
Above 379.32 → 379.46 next
Above 379.46 → 379.63 next
Above 379.63 → 380.95 next
Above 380.95 → 388.22 next
Above 388.22 → 388.54 next
Above 388.54 → 388.91 next
Above 388.91 → open air
Lose 379.09 → 378.88 next
Lose 378.88 → 378.83 next
Lose 378.83 → 378.23 next
Lose 378.23 → 377.62 next
Lose 377.62 → 377.51 next
Lose 377.51 → 377.43 next
Lose 377.43 → open air
BTC (Bitcoin)
Nearest pivot: 74789.25
Above 74789.25 → 74967.25 next
Above 74967.25 → 75007 next
Above 75007 → 75446.50 next
Above 75446.50 → open air
Lose 74735.50 → 74685.25 next
Lose 74685.25 → 74479.75 next
Lose 74479.75 → 72605.75 next
Lose 72605.75 → open air
ETH (Ethereum)
Nearest pivot: 2127.10
Above 2130.85 → 2219.30 next
Above 2219.30 → 2224.35 next
Above 2224.35 → 2228.30 next
Above 2228.30 → 2230.45 next
Above 2230.45 → open air
Lose 2127.10 → 2123.90 next
Lose 2123.90 → 2121.15 next
Lose 2121.15 → 2119.15 next
Lose 2119.15 → open air
GLD (SPDR Gold Shares)
Nearest pivot: 379.54
Above 379.54 → 379.73 next
Above 379.73 → 379.91 next
Above 379.91 → open air
Lose 379.39 → 379.14 next
Lose 379.14 → 378.97 next
Lose 378.97 → 378.18 next
Lose 378.18 → 377.59 next
Lose 377.59 → 377.09 next
Lose 377.09 → 376.92 next
Lose 376.92 → open air
SLV (iShares Silver Trust)
Nearest pivot: 48.26
Above 48.26 → 48.53 next
Above 48.53 → open air
Lose 47.97 → 47.87 next
Lose 47.87 → 47.70 next
Lose 47.70 → 47.54 next
Lose 47.54 → 47.38 next
Lose 47.38 → 47.21 next
Lose 47.21 → open air
CL (Crude Oil futures)
Nearest pivot: 87.13
Above 87.13 → 87.30 next
Above 87.30 → 87.47 next
Above 87.47 → 87.75 next
Above 87.75 → 87.92 next
Above 87.92 → 88.07 next
Above 88.07 → open air
Lose 86.88 → 86.66 next
Lose 86.66 → open air
GC (Gold futures)
Nearest pivot: 4151.30
Above 4151.30 → 4156.60 next
Above 4156.60 → 4160.90 next
Above 4160.90 → open air
Lose 4145.60 → 4137.50 next
Lose 4137.50 → 4131.60 next
Lose 4131.60 → 4129.80 next
Lose 4129.80 → open air
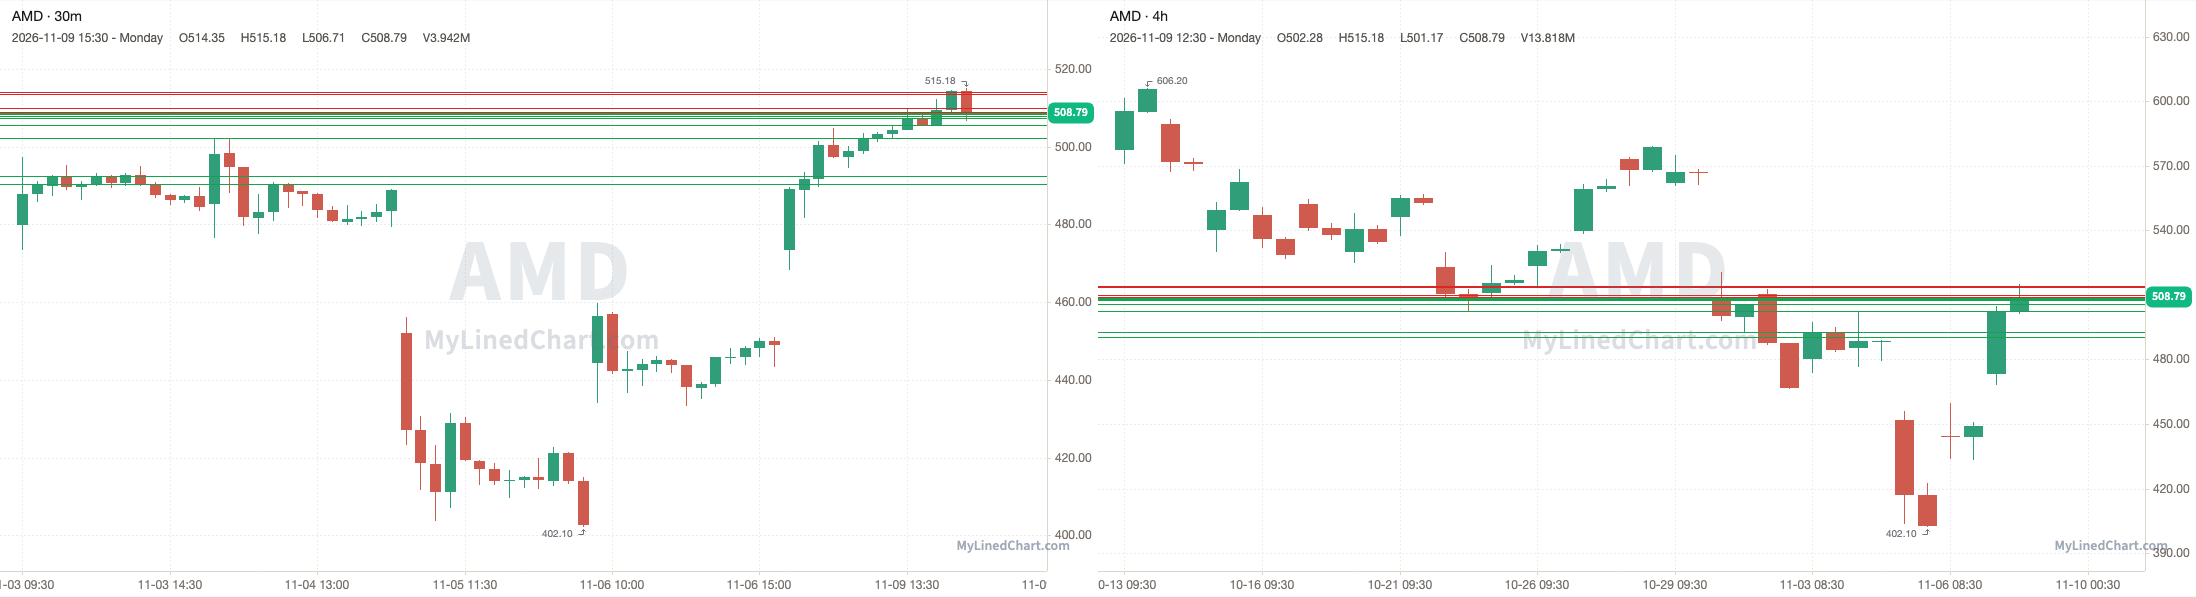
AMD (Advanced Micro Devices)
Nearest pivot: 508.75
Above 509.05 → 510 next
Above 510 → 513.67 next
Above 513.67 → 514.02 next
Above 514.02 → open air
Lose 508.75 → 508.57 next
Lose 508.57 → 508.03 next
Lose 508.03 → 507.47 next
Lose 507.47 → 505.55 next
Lose 505.55 → 502.28 next
Lose 502.28 → 492.53 next
Lose 492.53 → 490.53 next
Lose 490.53 → open air
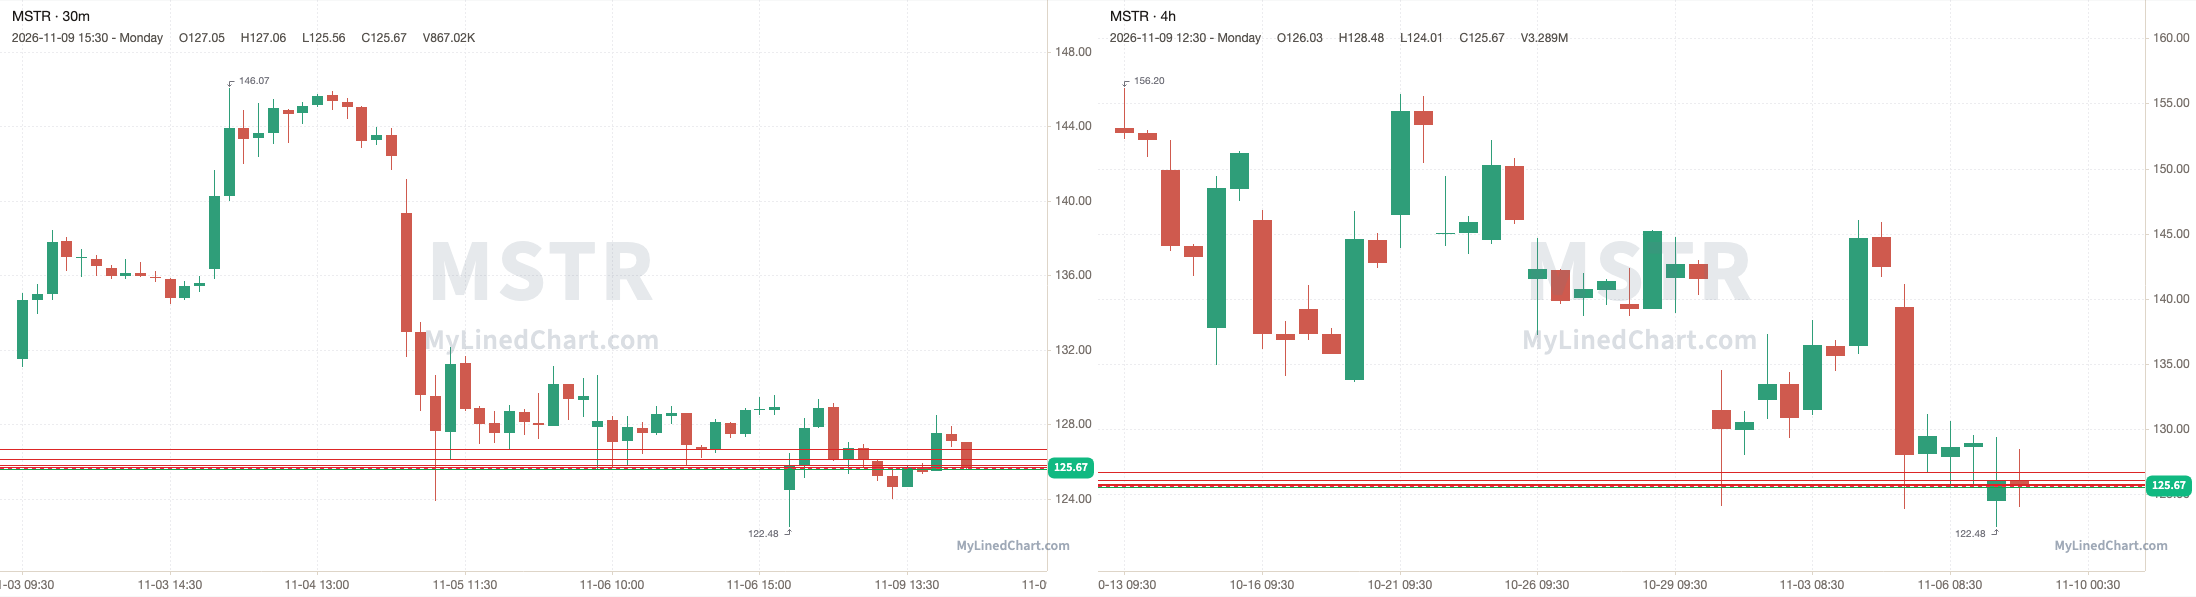
MSTR (Strategy)
Nearest pivot: 125.68
Above 125.68 → 125.82 next
Above 125.82 → 126.13 next
Above 126.13 → 126.67 next
Above 126.67 → open air
Lose 125.59 → open air
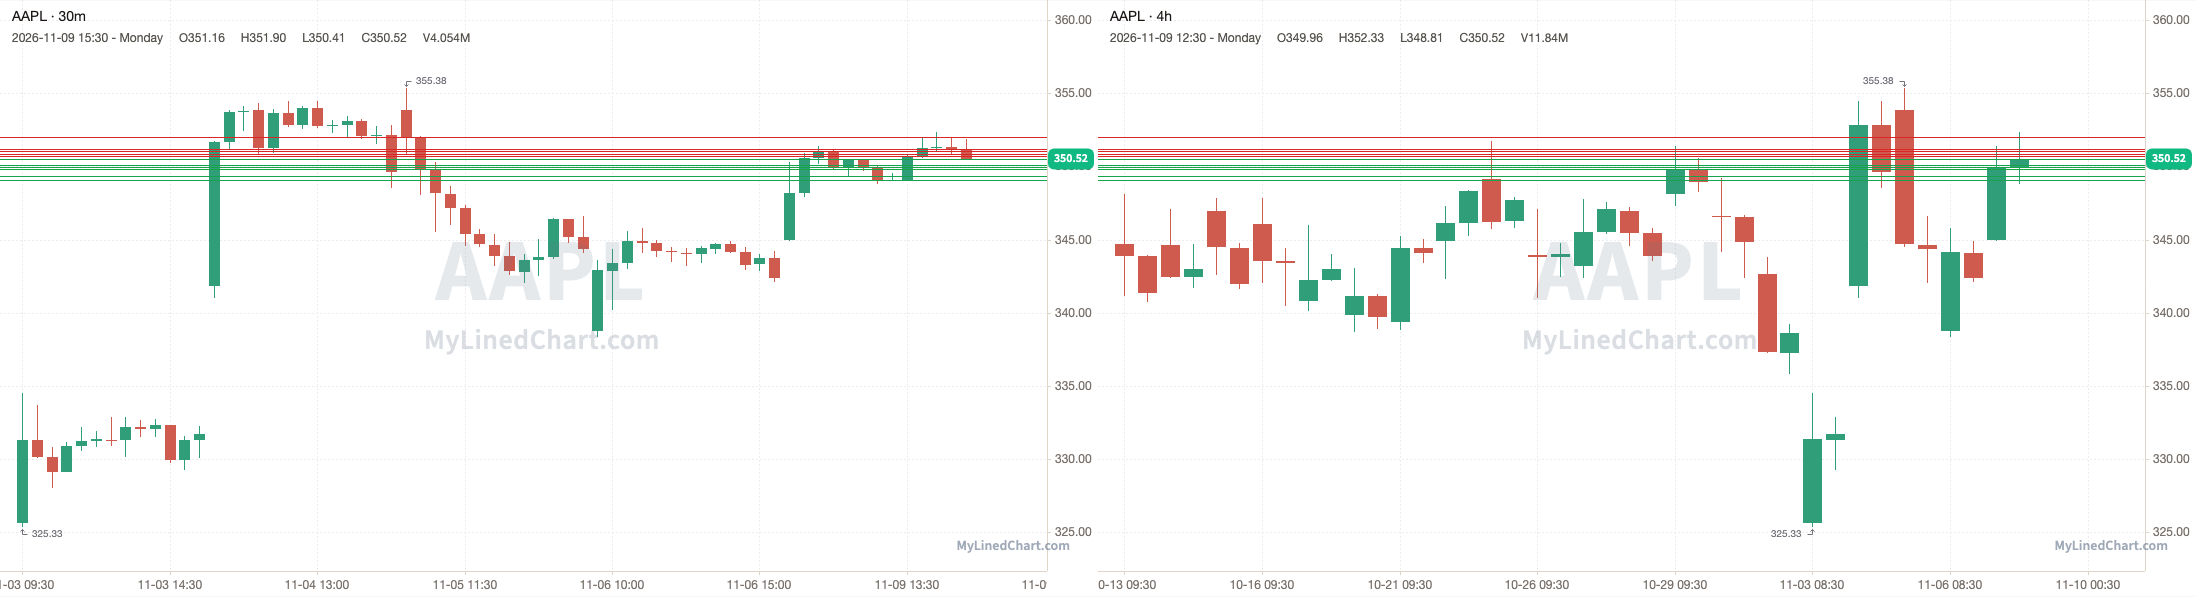
AAPL (Apple)
Nearest pivot: 350.49
Above 350.71 → 350.88 next
Above 350.88 → 351.04 next
Above 351.04 → 351.22 next
Above 351.22 → 351.99 next
Above 351.99 → open air
Lose 350.49 → 350.13 next
Lose 350.13 → 349.98 next
Lose 349.98 → 349.82 next
Lose 349.82 → 349.32 next
Lose 349.32 → 349.08 next
Lose 349.08 → open air
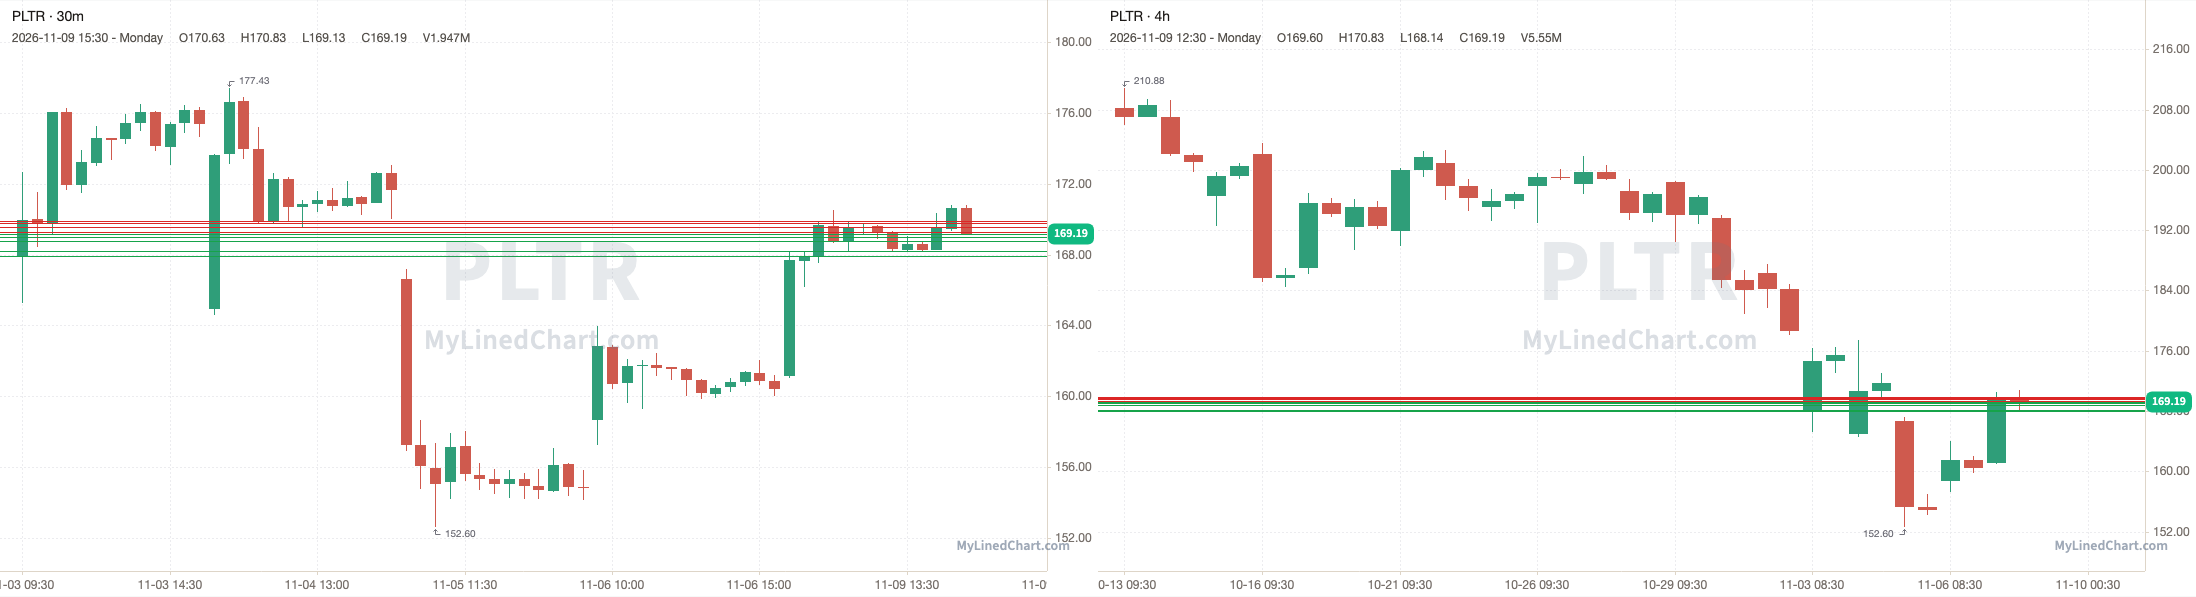
PLTR (Palantir)
Nearest pivot: 169.16
Above 169.28 → 169.56 next
Above 169.56 → 169.77 next
Above 169.77 → 169.91 next
Above 169.91 → open air
Lose 169.16 → 169 next
Lose 169 → 168.75 next
Lose 168.75 → 168.20 next
Lose 168.20 → 167.94 next
Lose 167.94 → open air
COIN (Coinbase)
Nearest pivot: 136.10
Above 136.35 → 136.56 next
Above 136.56 → 136.76 next
Above 136.76 → 137.10 next
Above 137.10 → 137.39 next
Above 137.39 → open air
Lose 136.10 → 136.01 next
Lose 136.01 → 135.46 next
Lose 135.46 → 134.87 next
Lose 134.87 → 134.79 next
Lose 134.79 → open air
AMZN (Amazon)
Nearest pivot: 267
Above 267.27 → 267.73 next
Above 267.73 → 267.91 next
Above 267.91 → 268.03 next
Above 268.03 → 268.14 next
Above 268.14 → open air
Lose 267 → 266.83 next
Lose 266.83 → 265.37 next
Lose 265.37 → 264.34 next
Lose 264.34 → 264.07 next
Lose 264.07 → 263.58 next
Lose 263.58 → 263.29 next
Lose 263.29 → 262.66 next
Lose 262.66 → open air
META (Meta Platforms)
Nearest pivot: 640.99
Above 642.01 → 642.16 next
Above 642.16 → 642.31 next
Above 642.31 → open air
Lose 640.99 → 640.49 next
Lose 640.49 → 639.67 next
Lose 639.67 → 634.99 next
Lose 634.99 → 630.64 next
Lose 630.64 → 621.57 next
Lose 621.57 → open air
MSFT (Microsoft)
Nearest pivot: 545.28
Above 545.45 → 546.35 next
Above 546.35 → 552.65 next
Above 552.65 → 555.01 next
Above 555.01 → 555.31 next
Above 555.31 → 557.63 next
Above 557.63 → open air
Lose 545.13 → 544.88 next
Lose 544.88 → 544.74 next
Lose 544.74 → 544.09 next
Lose 544.09 → 543.38 next
Lose 543.38 → 543.04 next
Lose 543.04 → open air
SMCI (Super Micro Computer)
Nearest pivot: 28.65
Above 28.65 → 28.81 next
Above 28.81 → 28.96 next
Above 28.96 → 29.03 next
Above 29.03 → open air
Lose 28.30 → 28.17 next
Lose 28.17 → 27.39 next
Lose 27.39 → open air
HOOD (Robinhood)
Nearest pivot: 83.34
Above 83.34 → 83.45 next
Above 83.45 → 83.54 next
Above 83.54 → 83.69 next
Above 83.69 → 83.86 next
Above 83.86 → 84 next
Above 84 → 84.22 next
Above 84.22 → open air
Lose 82.95 → 82.74 next
Lose 82.74 → 82.50 next
Lose 82.50 → 80.55 next
Lose 80.55 → 80.44 next
Lose 80.44 → 80.29 next
Lose 80.29 → 80.14 next
Lose 80.14 → open air
MARA (MARA Holdings)
Nearest pivot: 6.68
Above 6.68 → 6.85 next
Above 6.85 → 7.02 next
Above 7.02 → open air
Lose 6.37 → 6.21 next
Lose 6.21 → 6.04 next
Lose 6.04 → open air
GME (GameStop)
Nearest pivot: 25.66
Above 25.66 → 25.76 next
Above 25.76 → 25.85 next
Above 25.85 → 26.04 next
Above 26.04 → open air
Lose 25.41 → 25.18 next
Lose 25.18 → open air
IBIT (iShares Bitcoin Trust)
Nearest pivot: 42.29
Above 42.42 → 42.53 next
Above 42.53 → 42.88 next
Above 42.88 → open air
Lose 42.29 → 41.37 next
Lose 41.37 → open air
ETHA (iShares Ethereum Trust)
Nearest pivot: 48.03
Above 48.35 → 50.06 next
Above 50.06 → 50.14 next
Above 50.14 → 50.30 next
Above 50.30 → open air
Lose 48.03 → 47.84 next
Lose 47.84 → open air
INTC (Intel)
Nearest pivot: 59.11
Above 59.85 → 59.94 next
Above 59.94 → 60.02 next
Above 60.02 → 60.23 next
Above 60.23 → 60.32 next
Above 60.32 → open air
Lose 59.11 → 58.91 next
Lose 58.91 → 58.64 next
Lose 58.64 → 58.49 next
Lose 58.49 → 57.05 next
Lose 57.05 → 56.75 next
Lose 56.75 → open air
RIVN (Rivian)
Nearest pivot: 14.01
Above 14.27 → 14.46 next
Above 14.46 → open air
Lose 13.79 → open air
Don't want to wait until just before the open? Pro gets these levels about 1 hour after the close.
Pro also adds how many times price touched each level and the volume traded at that level.
Upgrade to Pro: https://littlebirdtrading.com/pricing
Touches and volume
Get touches and volumeThese levels arrive about 1 hour after the close, with touches and volume at every level.
✓ Every symbol with All Access✓ Sent to your inbox✓ MyLinedChart levels for your own rules and journaling
Disclaimer: Little Bird Trading and any of its associations may or may not, whether long or short, have a position in any instruments. Not investment advice. Provided for informational purposes only. Not a recommendation or endorsement. Not registered or licensed. Model portfolios are property of their respective owners. All data is sourced from publicly available information. No guarantee is being made or offered. Not responsible for financial loss or ruin. Little Bird Trading may earn a commission if you purchase through links on the site.