
Active Traders · NVDA, TSLA, BTC, GLD, CL and more
AMZN, META, MSTR, Ethereum, CL and 19 More Support and Resistance, Pivots and Highest Volume Levels for Day Traders, Nov 12
Published · Lee H.
MyLinedChart works however you get to a trade: AI-Assisted, Discretionary, Quant, or Macro. Export your lines, levels plus the whole chart as XLSX, JSON, or CSV. Or, let AI do all the work for you.
Here’s an overview of how MyLinedChart compares to TradingView and TrendSpider. Available on Windows, Apple and Android.
Looking for a pro to build your trading workflows? Reach out on Upwork.
A recap of how the November 11th trading session and levels played out:
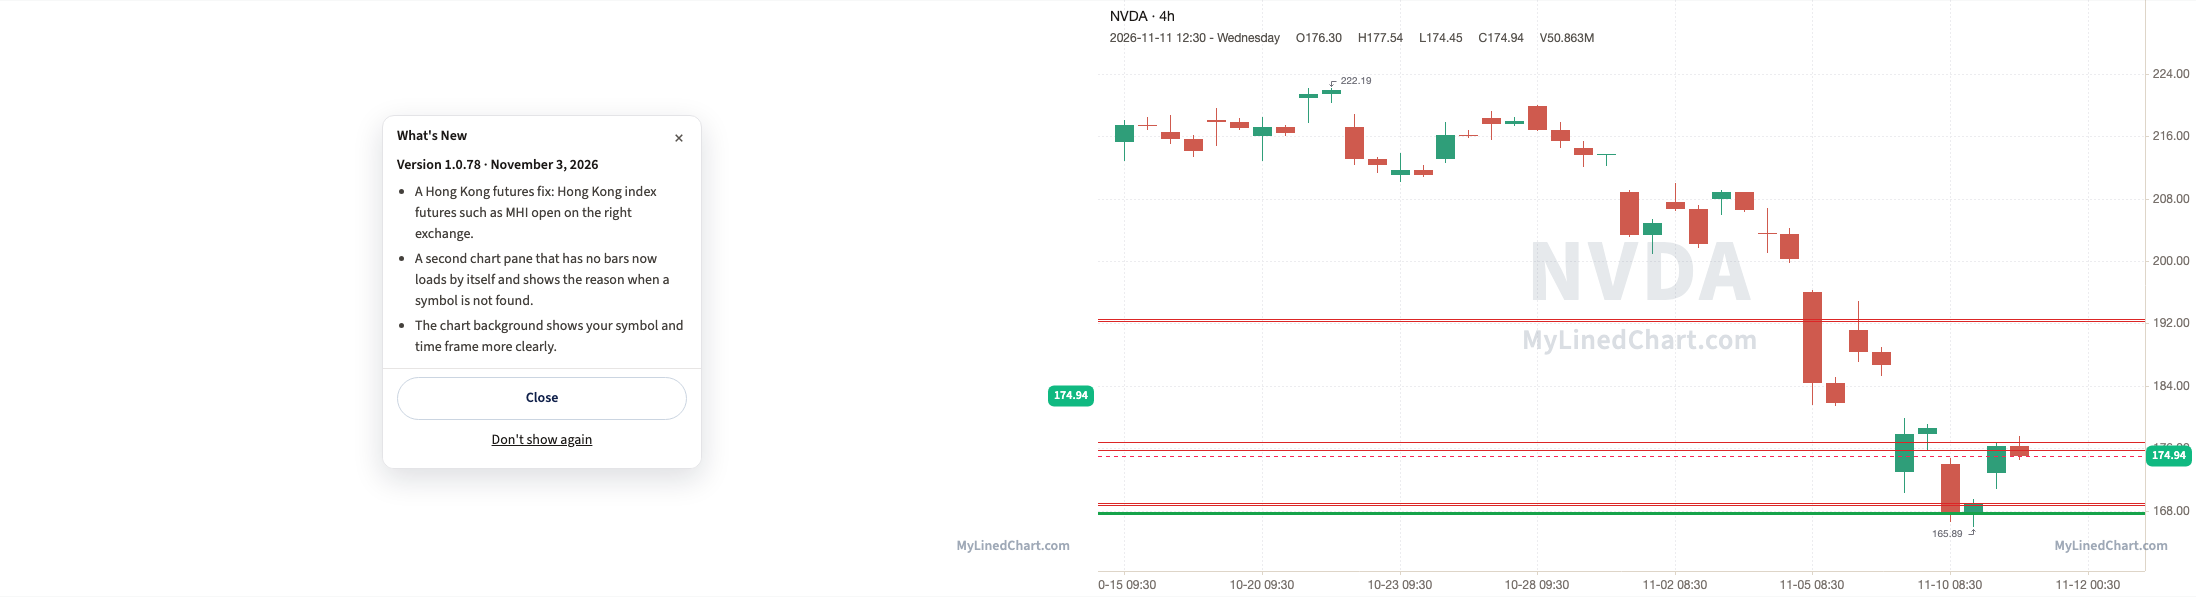
NVDA (NVIDIA)
NVDA opened at 172.77, held above the 168.70 pivot and ran up to tag 176.78, with a high of 177.54, then ended up closing at 174.94. Finishing the trading session up 1.26% intraday and up 3.85% overall.
November 11th session levels:
All listed levels: 167.58, 167.71, 167.87, 168.70, 169.02, 175.80, 176.78, 192.36, 192.56
Resistance above: 168.70, 169.02, 175.80, 176.78, 192.36, 192.56
Support below: 167.87, 167.71, 167.58
Nearest pivot: 168.70
Above 168.70 → 169.02 next
Lose 167.87 → 167.71 next
TSLA (Tesla)
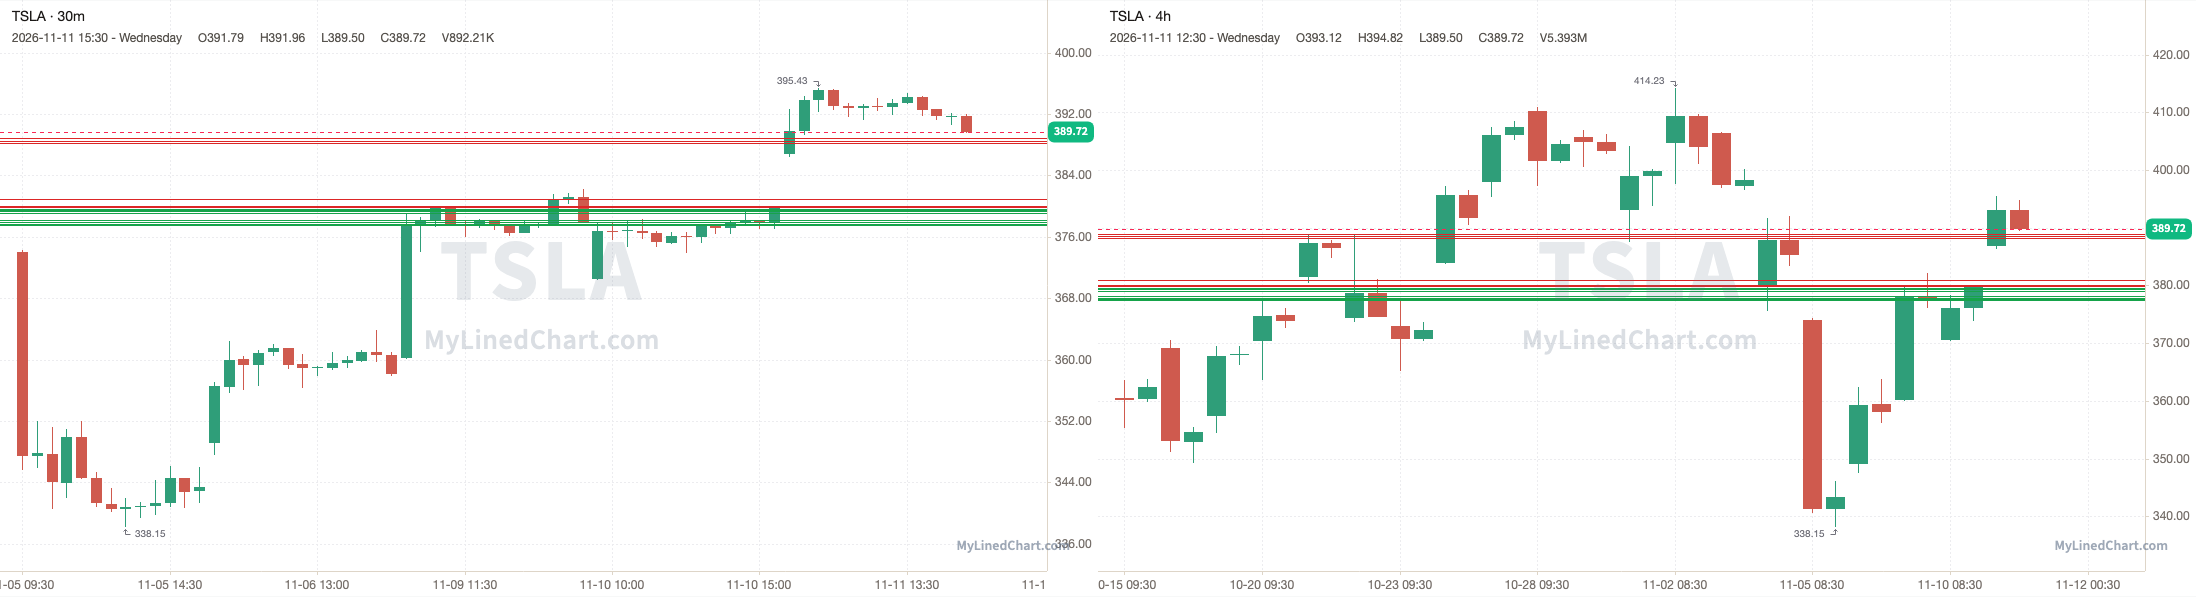
TSLA opened at 386.75, held above the 379.58 pivot and ran up to tag 388.91, with a high of 395.43, then ended up closing at 389.72. Finishing the trading session up 0.77% intraday and up 2.69% overall.
November 11th session levels:
All listed levels: 377.51, 377.63, 377.88, 378.20, 379.09, 379.31, 379.46, 379.58, 379.86, 380.03, 380.95, 388.22, 388.54, 388.91
Resistance above: 379.86, 380.03, 380.95, 388.22, 388.54, 388.91
Support below: 379.58, 379.46, 379.31, 379.09, 378.20, 377.88, 377.63, 377.51
Nearest pivot: 379.58
Above 379.86 → 380.03 next
Lose 379.58 → 379.46 next
BTC (Bitcoin)
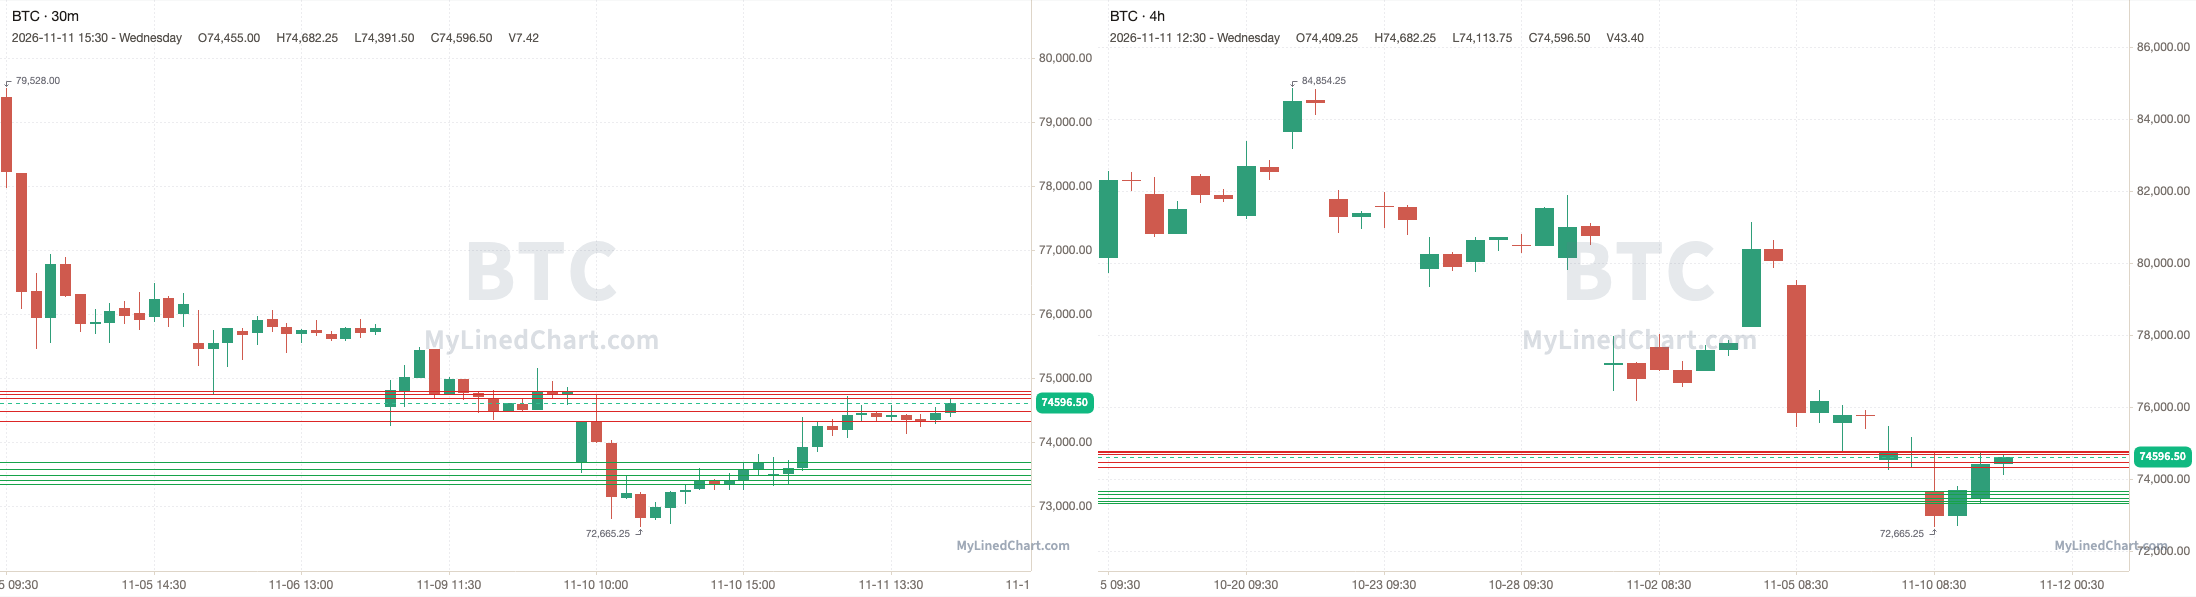
BTC opened at 73461, broke above the 73679.75 pivot and ran up to tag 74685.25, with a high of 74709.75, then ended up closing at 74596.50. Finishing the trading session up 1.55% intraday and up 1.24% overall.
November 11th session levels:
All listed levels: 73341.50, 73398.75, 73473, 73580.25, 73679.75, 74319, 74479.75, 74685.25, 74742.50, 74789.25
Resistance above: 74319, 74479.75, 74685.25, 74742.50, 74789.25
Support below: 73679.75, 73580.25, 73473, 73398.75, 73341.50
Nearest pivot: 73679.75
Above 74319 → 74479.75 next
Lose 73679.75 → 73580.25 next
ETH (Ethereum)
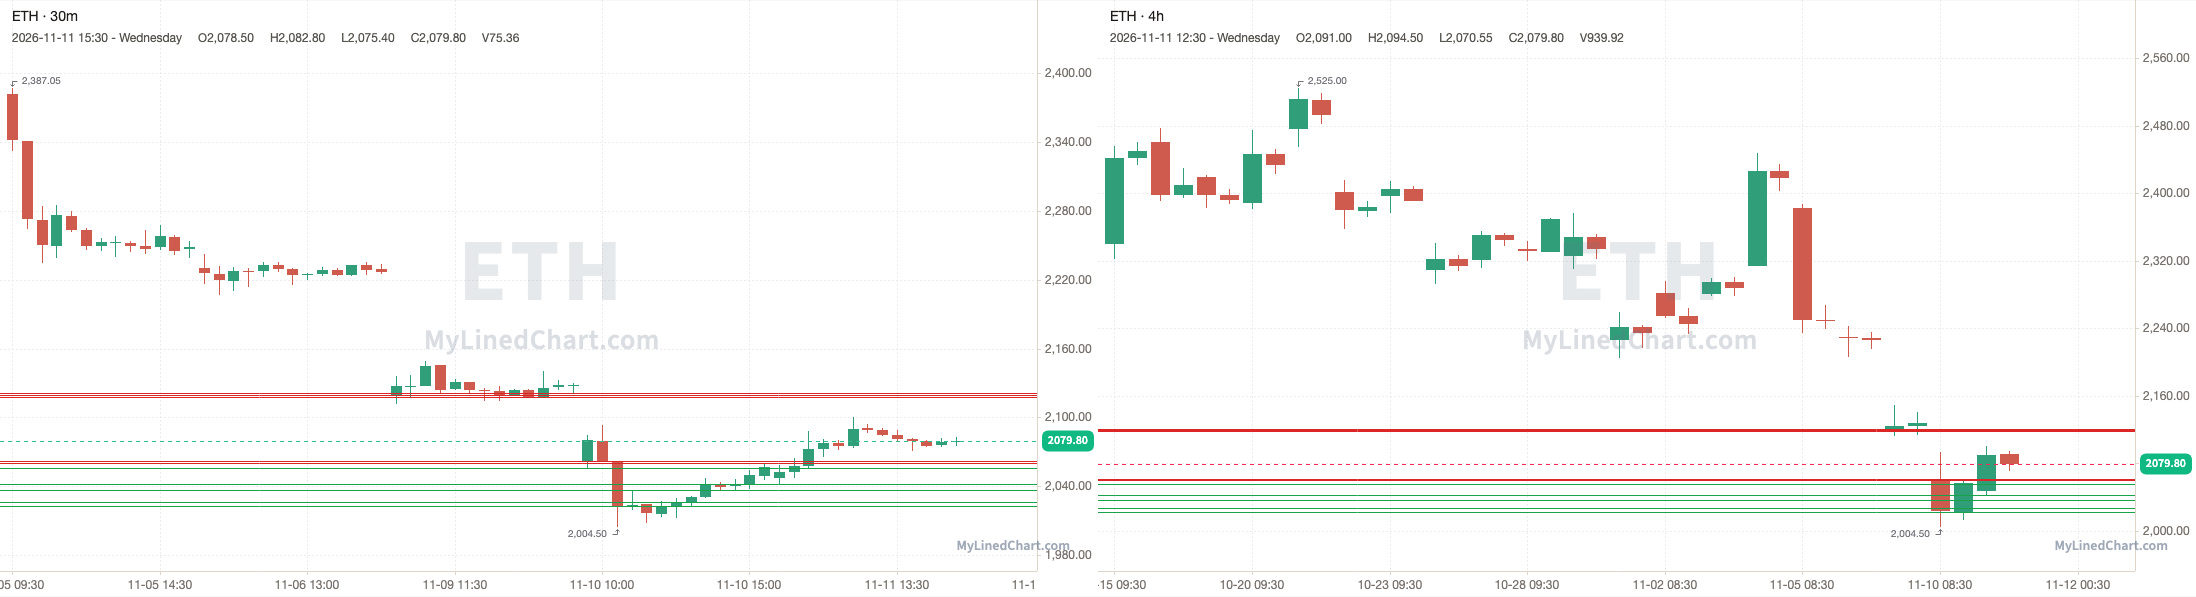
ETH opened at 2046.90, broke above the 2056 pivot and ran up to tag 2061.70, with a high of 2100.60, then ended up closing at 2079.80. Finishing the trading session up 1.61% intraday and up 1.10% overall.
November 11th session levels:
All listed levels: 2022.50, 2026.70, 2036.40, 2042.25, 2056, 2060.35, 2061.70, 2117.80, 2119.15, 2121.15
Resistance above: 2060.35, 2061.70, 2117.80, 2119.15, 2121.15
Support below: 2056, 2042.25, 2036.40, 2026.70, 2022.50
Nearest pivot: 2056
Above 2060.35 → 2061.70 next
Lose 2056 → 2042.25 next
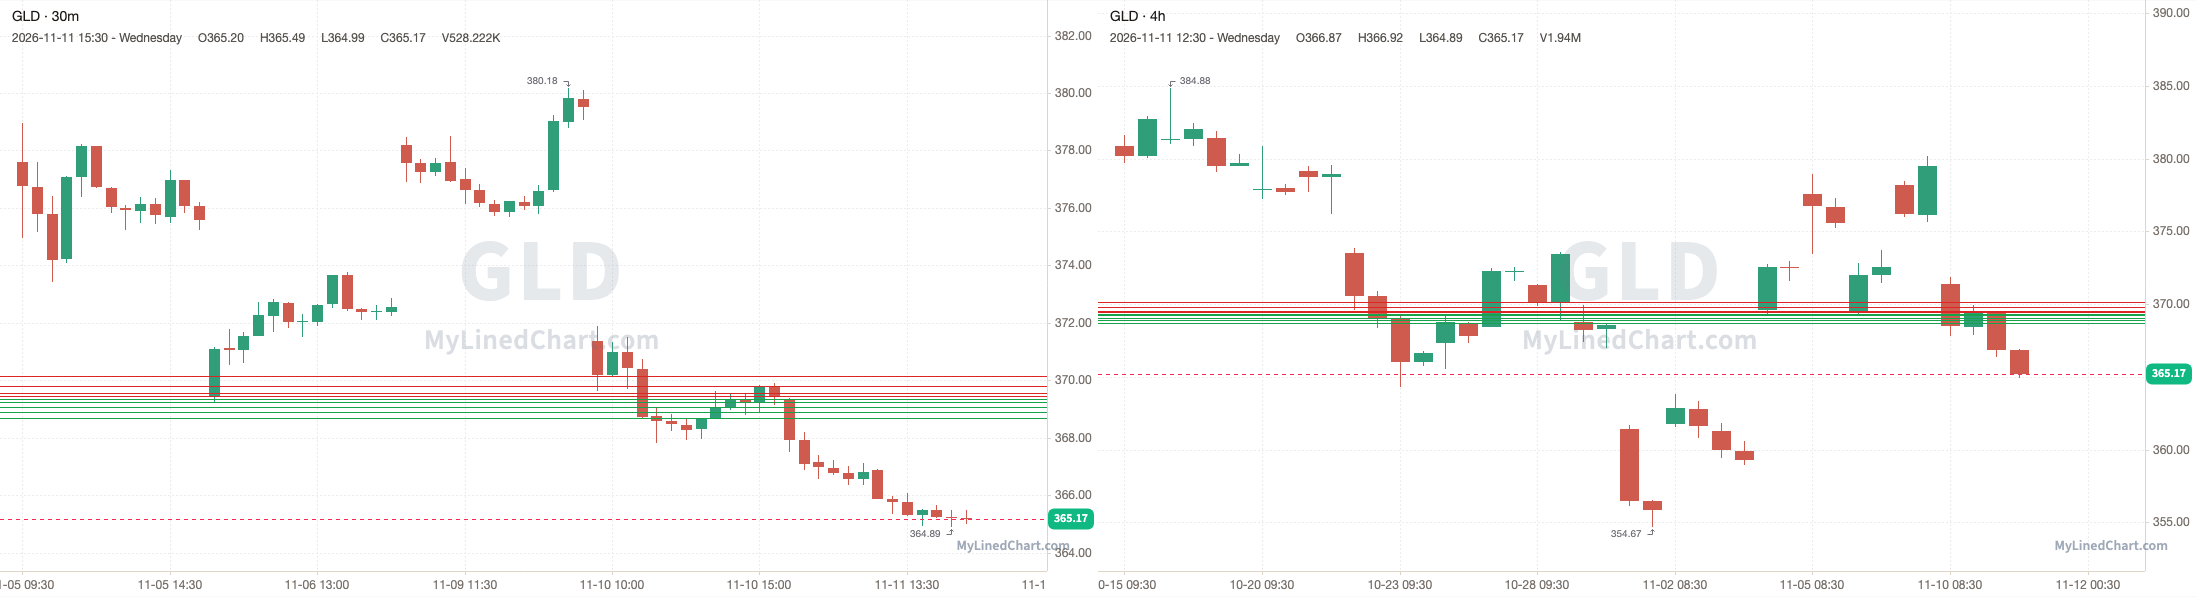
GLD (SPDR Gold Shares)
GLD opened at 369.36, stayed under the 369.45 pivot and ran through every support level down to 368.70, and kept going to a low of 364.89, then ended up closing at 365.17. Finishing the trading session down 1.13% intraday and down 1.15% overall.
November 11th session levels:
All listed levels: 368.70, 368.91, 369.06, 369.24, 369.35, 369.45, 369.56, 369.80, 370.16
Resistance above: 369.45, 369.56, 369.80, 370.16
Support below: 369.35, 369.24, 369.06, 368.91, 368.70
Nearest pivot: 369.45
Above 369.45 → 369.56 next
Lose 369.35 → 369.24 next
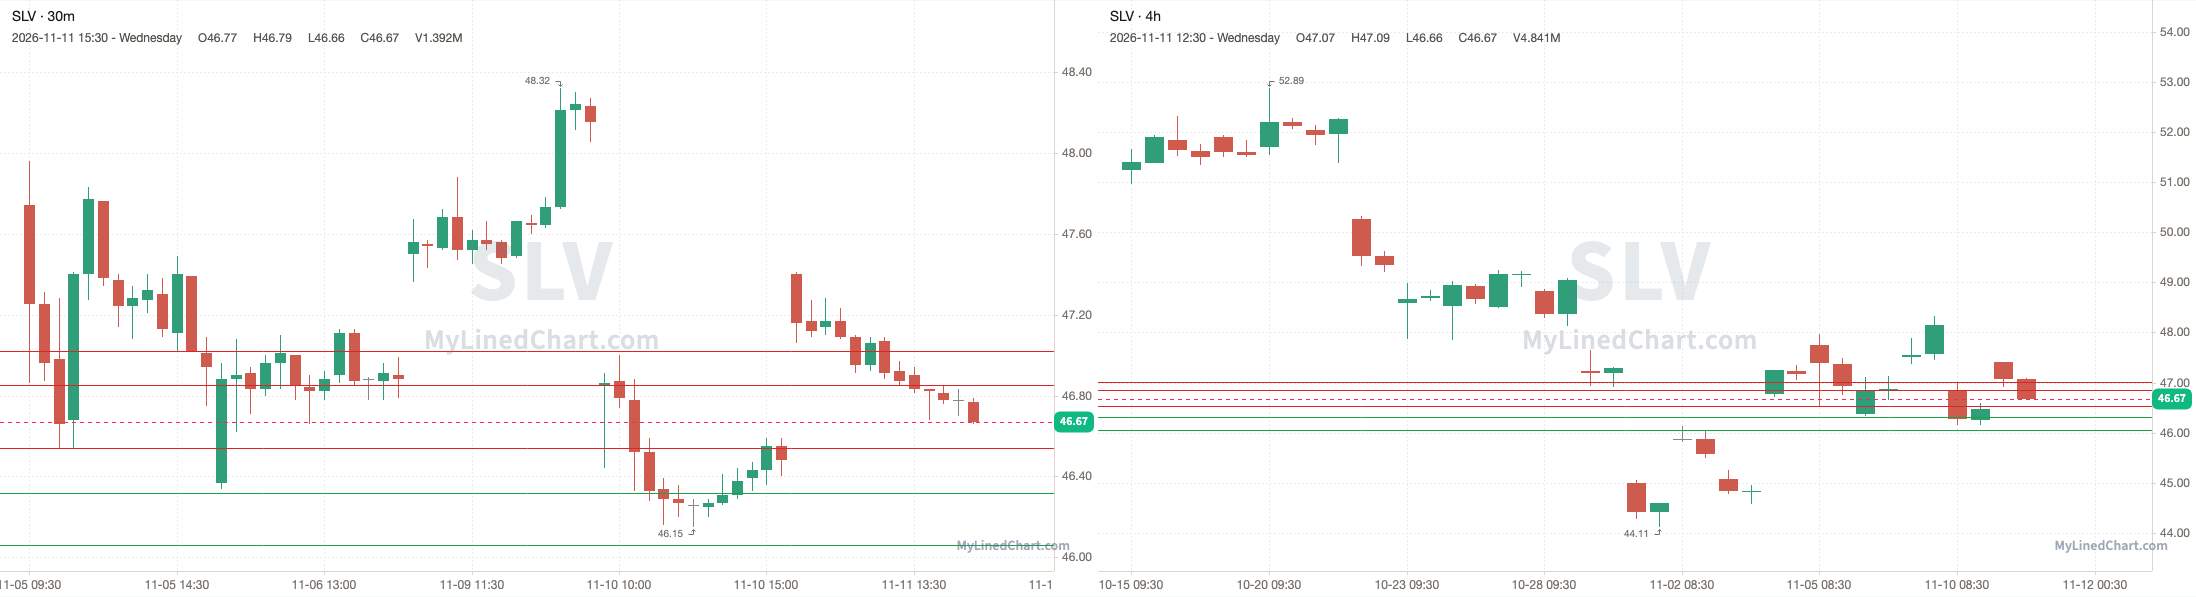
SLV (iShares Silver Trust)
SLV opened at 47.40, held above the 46.54 pivot and dropped to a low of 46.66, then ended up closing at 46.67. Finishing the trading session down 1.54% intraday and up 0.41% overall.
November 11th session levels:
All listed levels: 46.06, 46.32, 46.54, 46.85, 47.02
Resistance above: 46.54, 46.85, 47.02
Support below: 46.32, 46.06
Nearest pivot: 46.54
Above 46.54 → 46.85 next
Lose 46.32 → 46.06 next
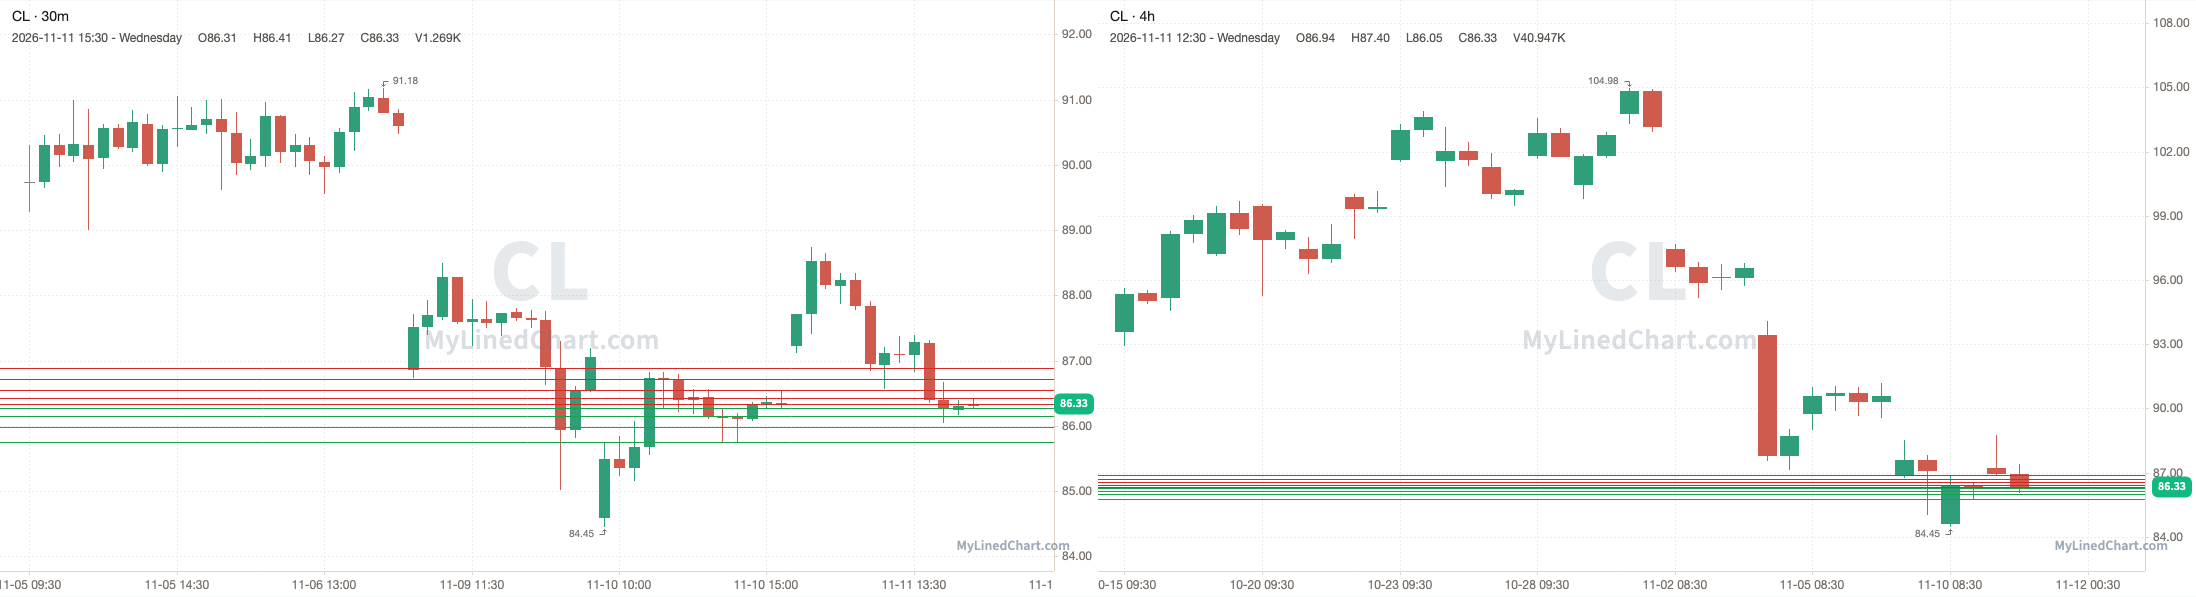
CL (Crude Oil futures)
CL opened at 87.23, broke below the 86.34 pivot and dropped to tag 86.15, with a low of 86.05, then ended up closing at 86.33. Finishing the trading session down 1.03% intraday.
November 11th session levels:
All listed levels: 85.76, 85.99, 86.15, 86.27, 86.34, 86.43, 86.55, 86.72, 86.88
Resistance above: 86.43, 86.55, 86.72, 86.88
Support below: 86.27, 86.15, 85.99, 85.76
Nearest pivot: 86.34
Above 86.43 → 86.55 next
Lose 86.27 → 86.15 next
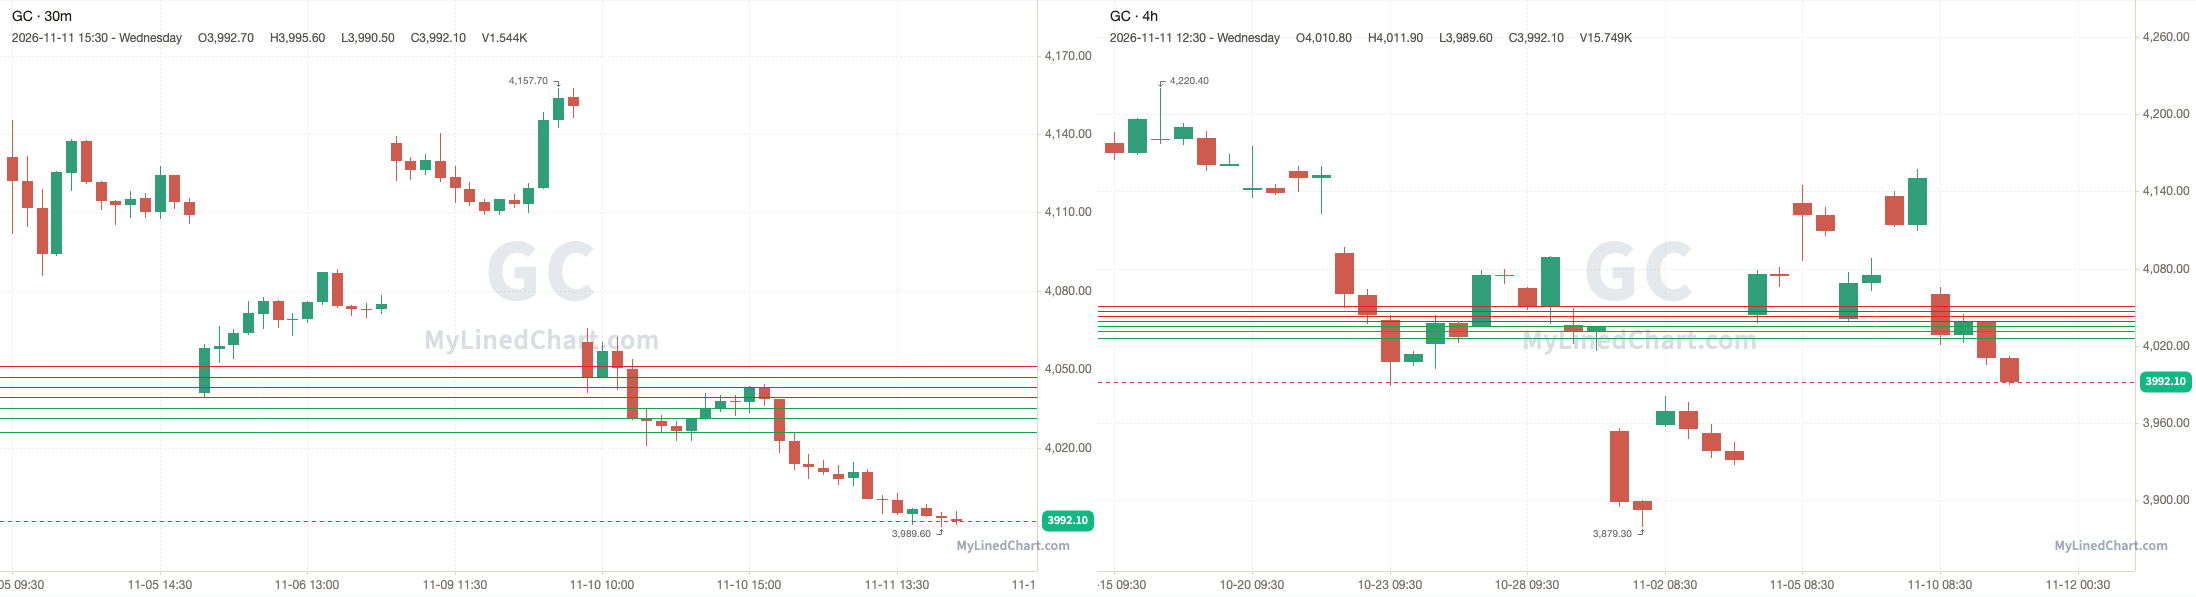
GC (Gold futures)
GC opened at 4038.70, stayed under the 4039.20 pivot and ran through every support level down to 4026.10, and kept going to a low of 3989.60, then ended up closing at 3992.10. Finishing the trading session down 1.15% intraday.
November 11th session levels:
All listed levels: 4026.10, 4031.30, 4035.30, 4039.20, 4043.40, 4046.90, 4051.30
Resistance above: 4039.20, 4043.40, 4046.90, 4051.30
Support below: 4035.30, 4031.30, 4026.10
Nearest pivot: 4039.20
Above 4039.20 → 4043.40 next
Lose 4035.30 → 4031.30 next
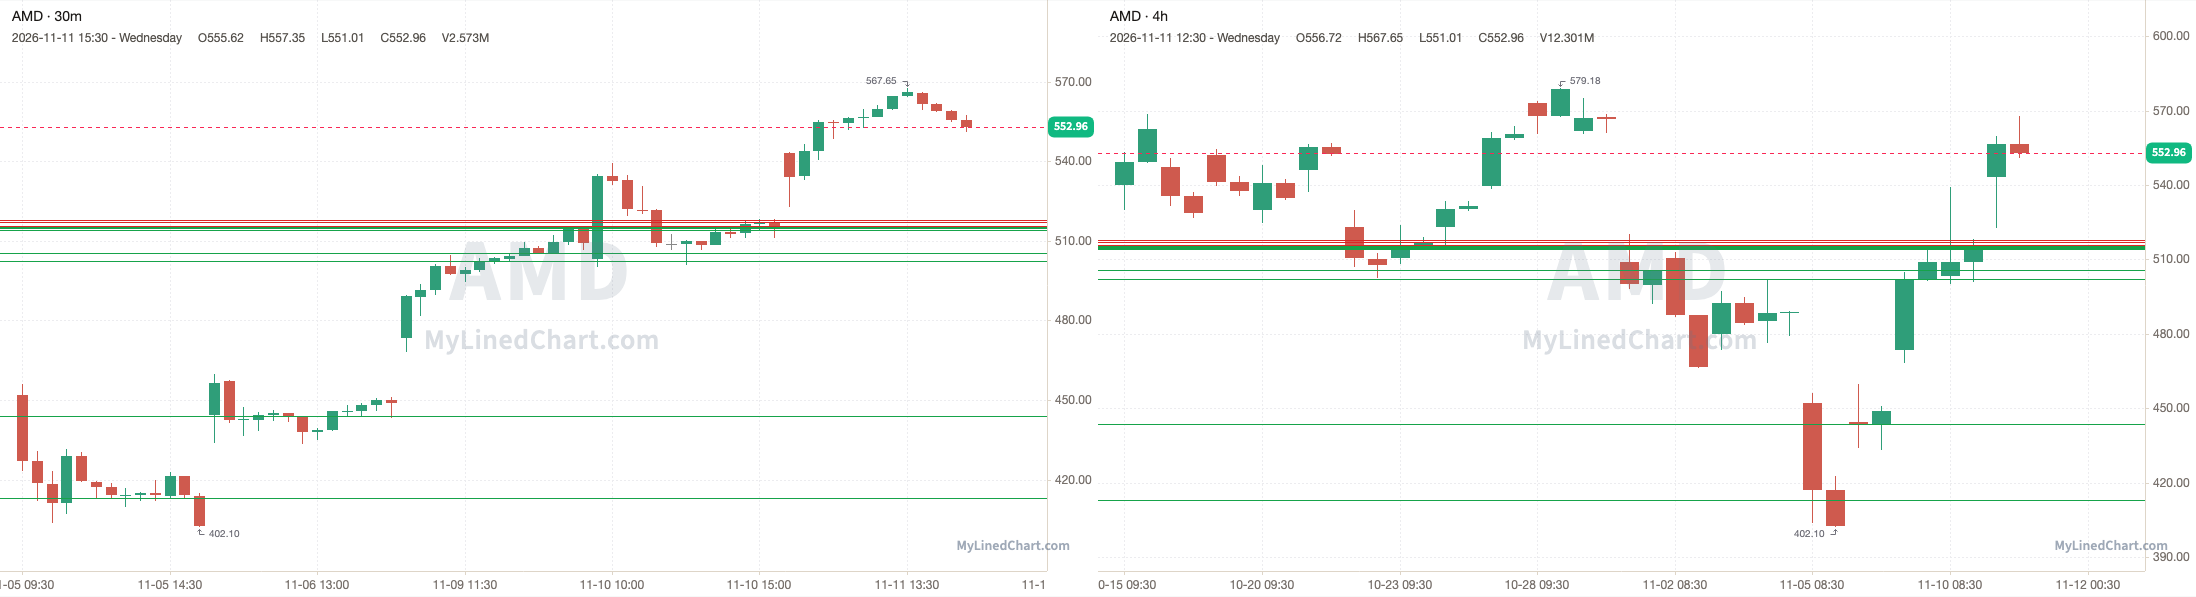
AMD (Advanced Micro Devices)
AMD opened at 543.07, over the 515.47 pivot and every level in the plan, and never traded back down to them, with a high of 567.65 and a low of 522.65, then ended up closing at 552.96. Finishing the trading session up 1.82% intraday and up 7.27% overall.
November 11th session levels:
All listed levels: 413.06, 443.79, 502.28, 505.55, 514.02, 514.72, 515.16, 515.47, 515.69, 517.13, 517.76, 518
Resistance above: 515.69, 517.13, 517.76, 518
Support below: 515.47, 515.16, 514.72, 514.02, 505.55, 502.28, 443.79, 413.06
Nearest pivot: 515.47
Above 515.69 → 517.13 next
Lose 515.47 → 515.16 next
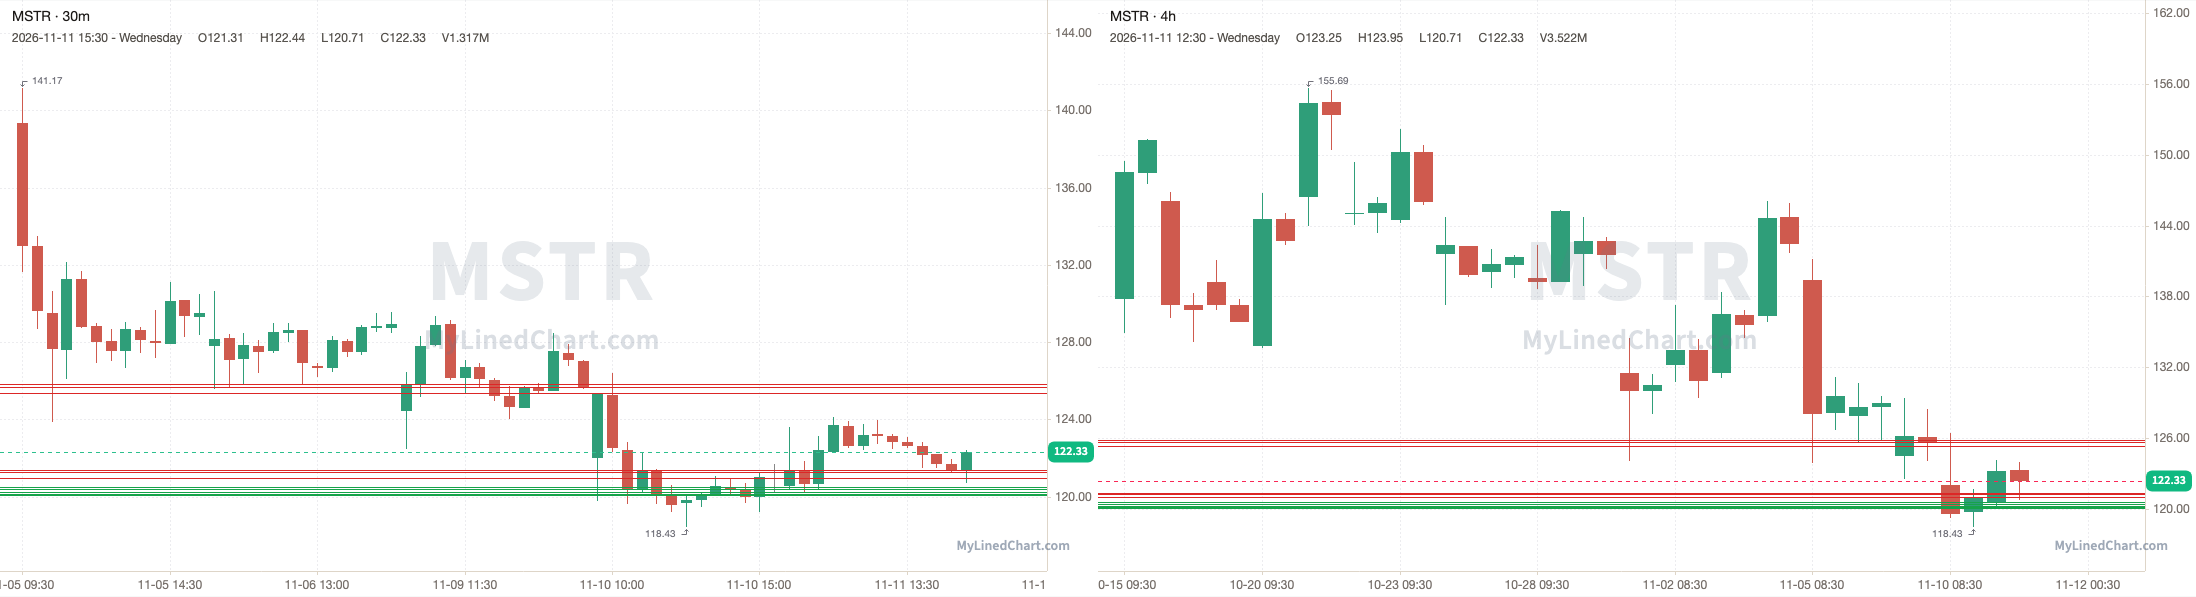
MSTR (Strategy)
MSTR opened at 120.54, broke above the 120.99 pivot and ran up to tag 121.36, with a high of 124.14, then ended up closing at 122.33. Finishing the trading session up 1.48% intraday and up 1.11% overall.
November 11th session levels:
All listed levels: 120.07, 120.16, 120.24, 120.38, 120.52, 120.99, 121.26, 121.36, 125.35, 125.68, 125.82
Resistance above: 121.26, 121.36, 125.35, 125.68, 125.82
Support below: 120.52, 120.38, 120.24, 120.16, 120.07
Nearest pivot: 120.99
Above 121.26 → 121.36 next
Lose 120.52 → 120.38 next
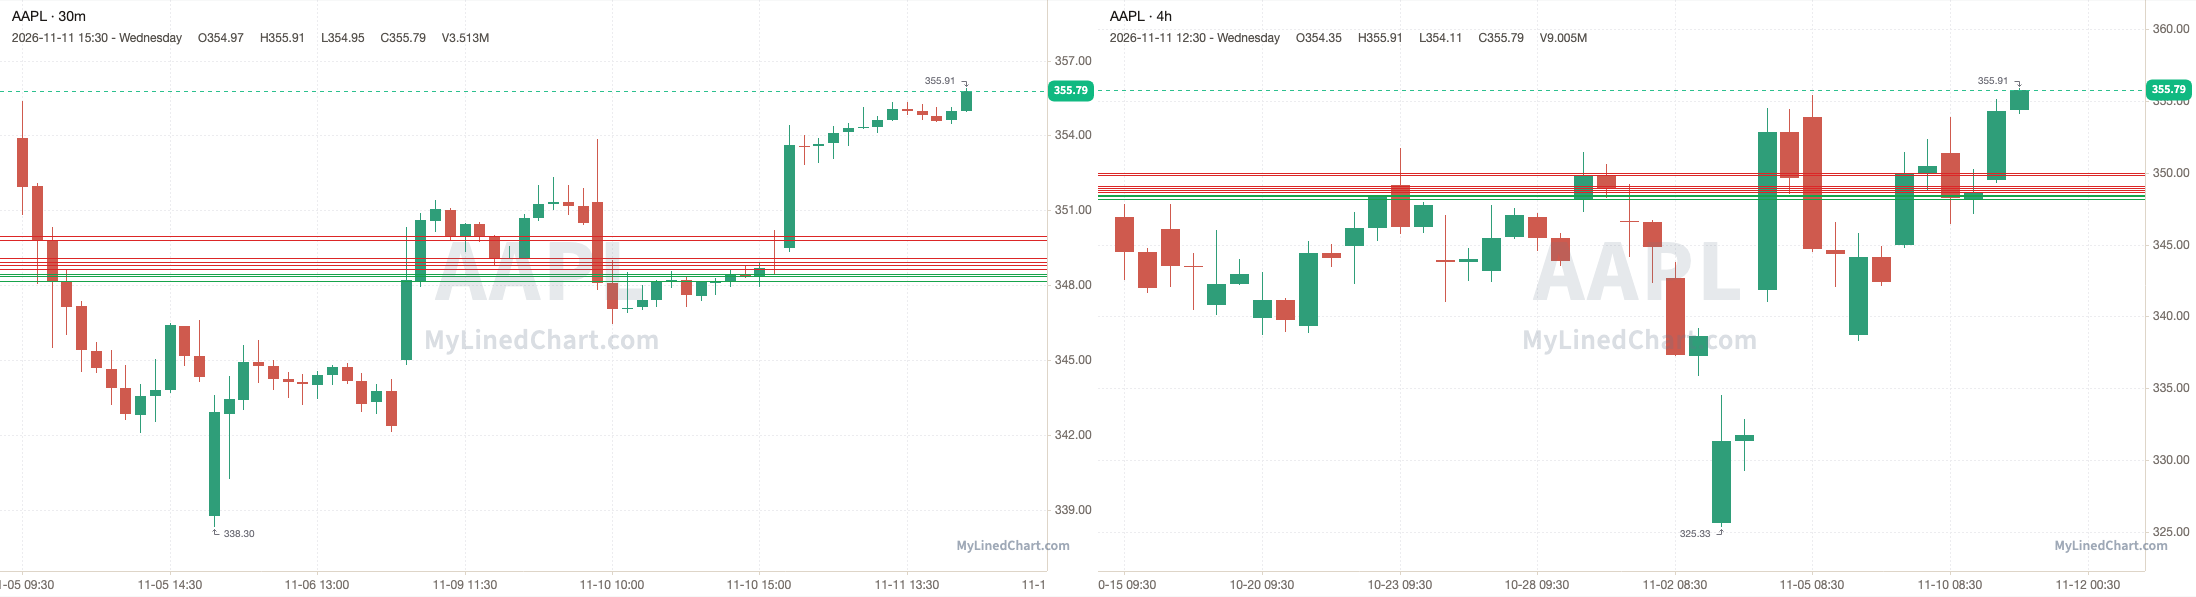
AAPL (Apple)
AAPL opened at 349.49, held above the 348.66 pivot and ran up to tag 349.98, with a high of 355.91, then ended up closing at 355.79. Finishing the trading session up 1.80% intraday and up 2.05% overall.
November 11th session levels:
All listed levels: 348.16, 348.37, 348.45, 348.66, 348.82, 348.92, 349.08, 349.82, 349.98
Resistance above: 348.66, 348.82, 348.92, 349.08, 349.82, 349.98
Support below: 348.45, 348.37, 348.16
Nearest pivot: 348.66
Above 348.66 → 348.82 next
Lose 348.45 → 348.37 next
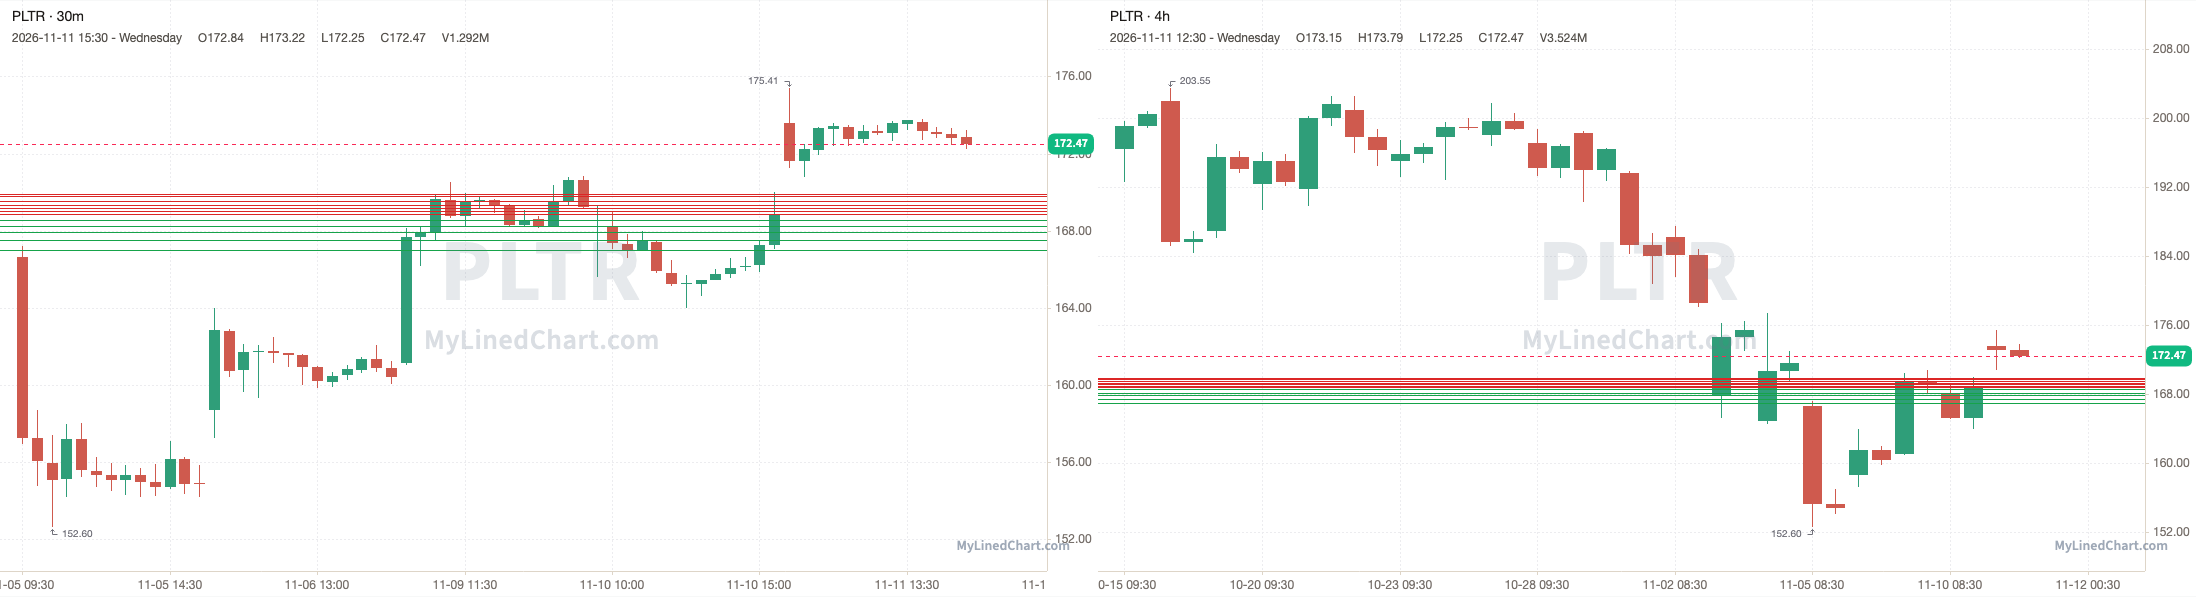
PLTR (Palantir)
PLTR opened at 173.59, over the 168.85 pivot and every level in the plan, and never traded back down to them, with a high of 175.41 and a low of 170.80, then ended up closing at 172.47. Finishing the trading session down 0.65% intraday and up 2.15% overall.
November 11th session levels:
All listed levels: 167, 167.50, 167.94, 168.21, 168.56, 168.85, 169, 169.16, 169.31, 169.55, 169.79, 169.91
Resistance above: 168.85, 169, 169.16, 169.31, 169.55, 169.79, 169.91
Support below: 168.56, 168.21, 167.94, 167.50, 167
Nearest pivot: 168.85
Above 168.85 → 169 next
Lose 168.56 → 168.21 next
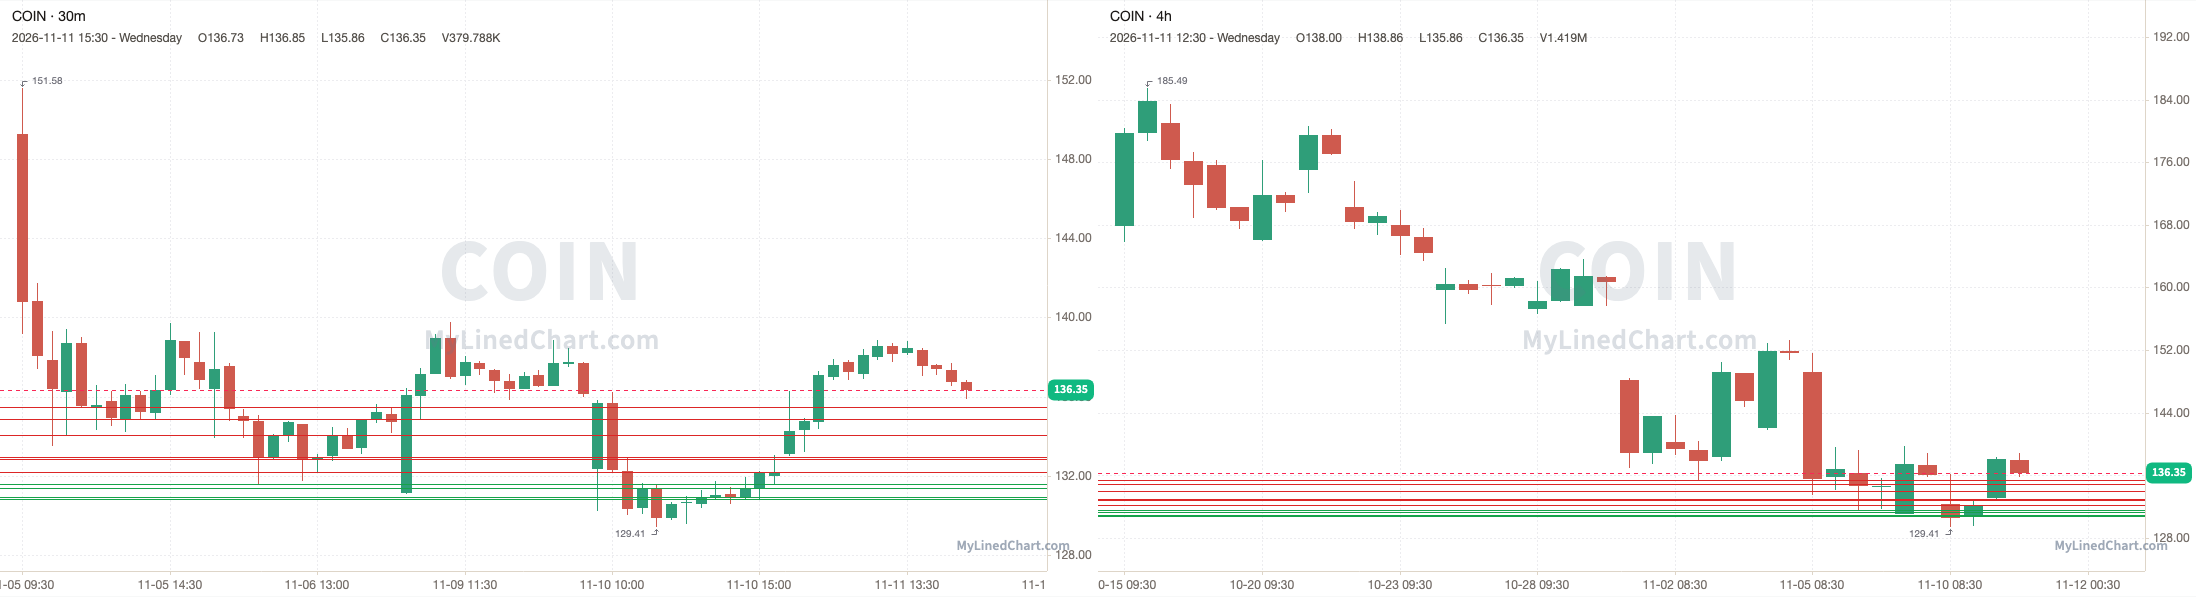
COIN (Coinbase)
COIN opened at 133.09, held above the 132.17 pivot and ran up to tag 135.46, with a high of 138.86, then ended up closing at 136.35. Finishing the trading session up 2.45% intraday and up 3.17% overall.
November 11th session levels:
All listed levels: 130.83, 130.92, 131.36, 131.57, 132.17, 132.86, 132.94, 134.08, 134.87, 135.46
Resistance above: 132.17, 132.86, 132.94, 134.08, 134.87, 135.46
Support below: 131.57, 131.36, 130.92, 130.83
Nearest pivot: 132.17
Above 132.17 → 132.86 next
Lose 131.57 → 131.36 next
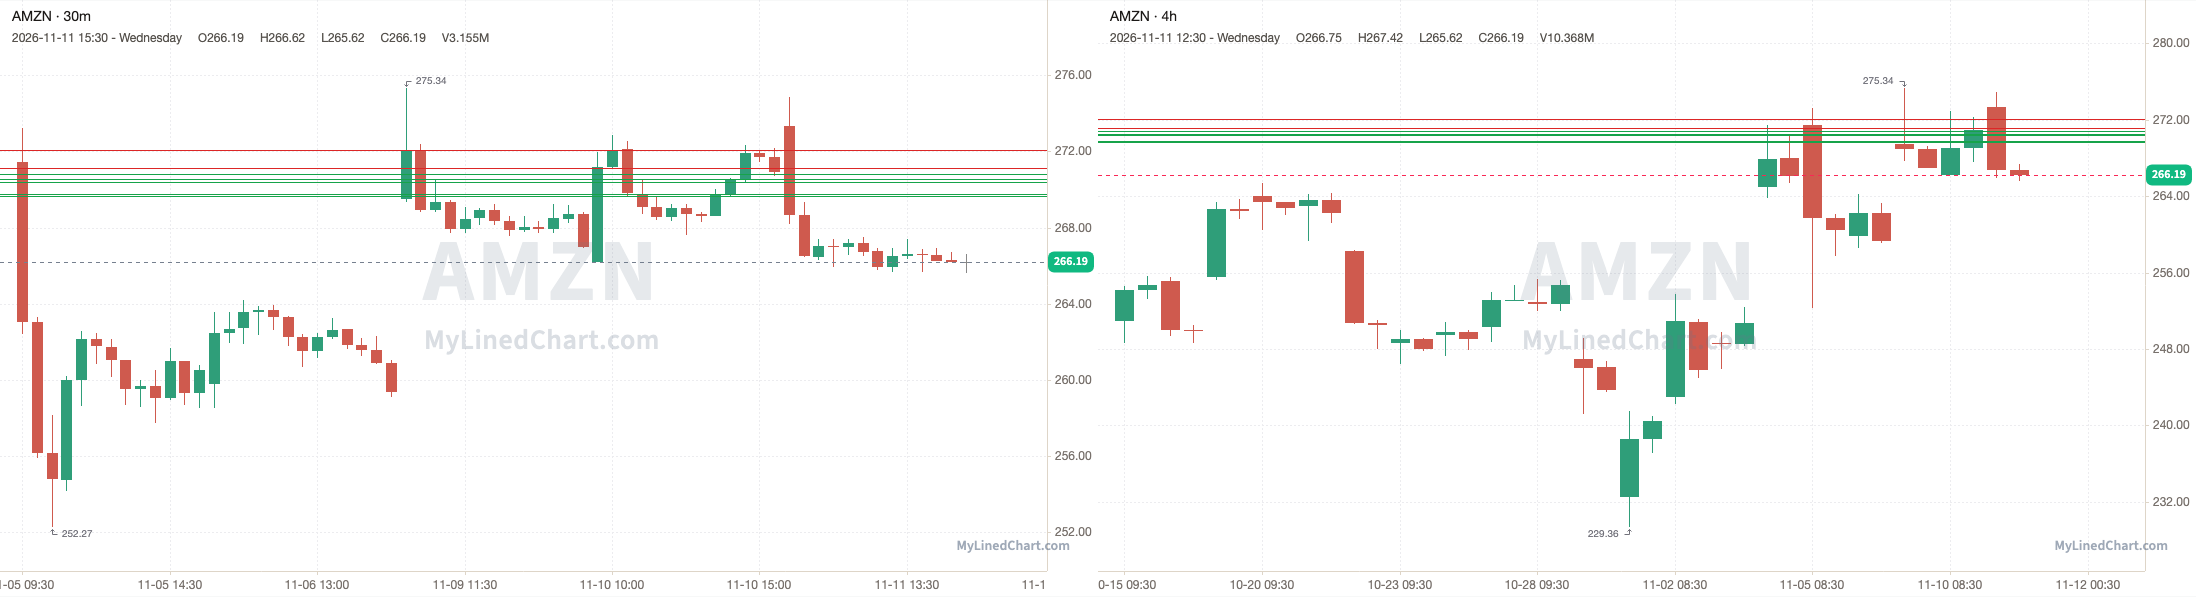
AMZN (Amazon)
AMZN opened at 273.31, broke below the 270.79 pivot and ran through every support level down to 269.66, and kept going to a low of 265.62, then ended up closing at 266.19. Finishing the trading session down 2.61% intraday and down 1.74% overall.
November 11th session levels:
All listed levels: 269.66, 269.75, 270.39, 270.55, 270.79, 271.11, 272.08
Resistance above: 271.11, 272.08
Support below: 270.79, 270.55, 270.39, 269.75, 269.66
Nearest pivot: 270.79
Above 271.11 → 272.08 next
Lose 270.79 → 270.55 next
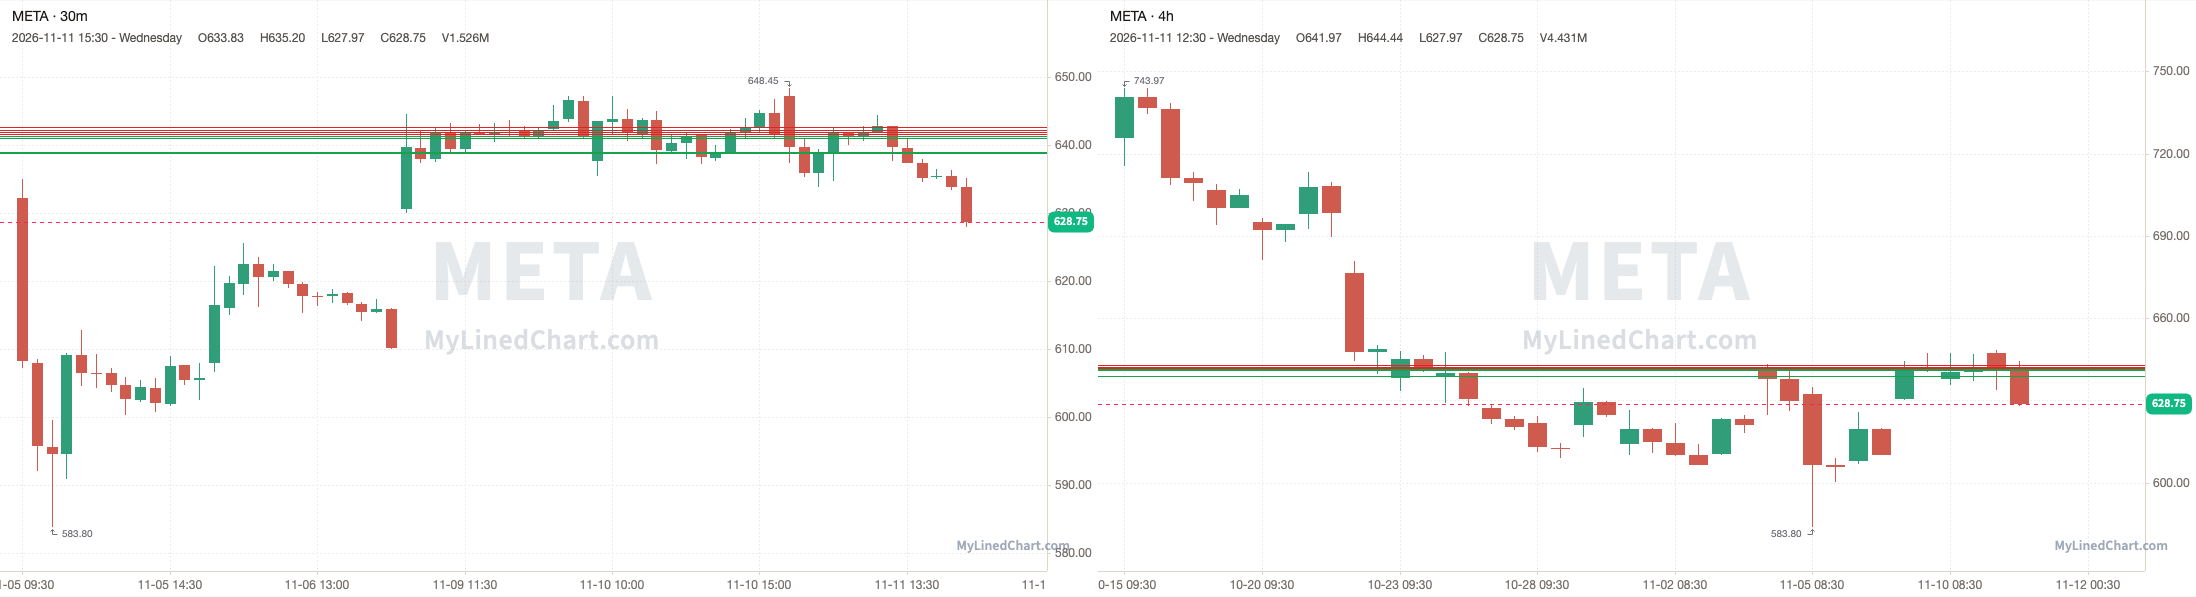
META (Meta Platforms)
META opened at 647.24, broke below the 641.71 pivot and ran through every support level down to 638.86, and kept going to a low of 627.97, then ended up closing at 628.75. Finishing the trading session down 2.86% intraday and down 2.01% overall.
November 11th session levels:
All listed levels: 638.86, 638.97, 641, 641.41, 641.71, 642.01, 642.31, 642.74
Resistance above: 641.71, 642.01, 642.31, 642.74
Support below: 641.41, 641, 638.97, 638.86
Nearest pivot: 641.71
Above 641.71 → 642.01 next
Lose 641.41 → 641 next
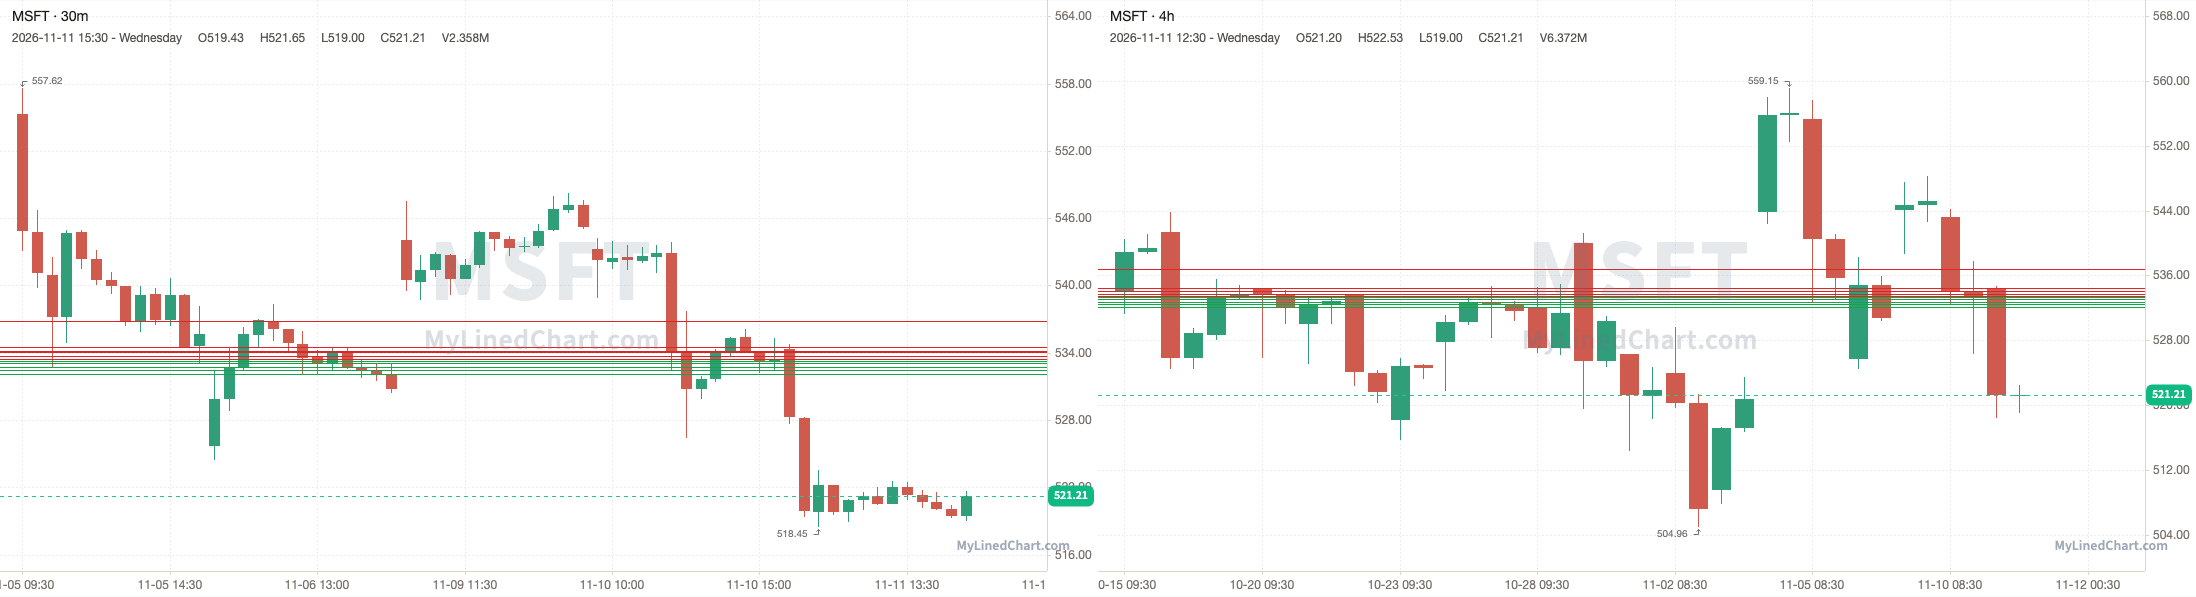
MSFT (Microsoft)
MSFT opened at 534.37, broke below the 533.46 pivot and ran through every support level down to 532.12, and kept going to a low of 518.45, then ended up closing at 521.21. Finishing the trading session down 2.46% intraday and down 2.29% overall.
November 11th session levels:
All listed levels: 532.12, 532.45, 532.74, 533.06, 533.29, 533.46, 533.70, 534.03, 534.12, 534.47, 536.85
Resistance above: 533.46, 533.70, 534.03, 534.12, 534.47, 536.85
Support below: 533.29, 533.06, 532.74, 532.45, 532.12
Nearest pivot: 533.46
Above 533.46 → 533.70 next
Lose 533.29 → 533.06 next
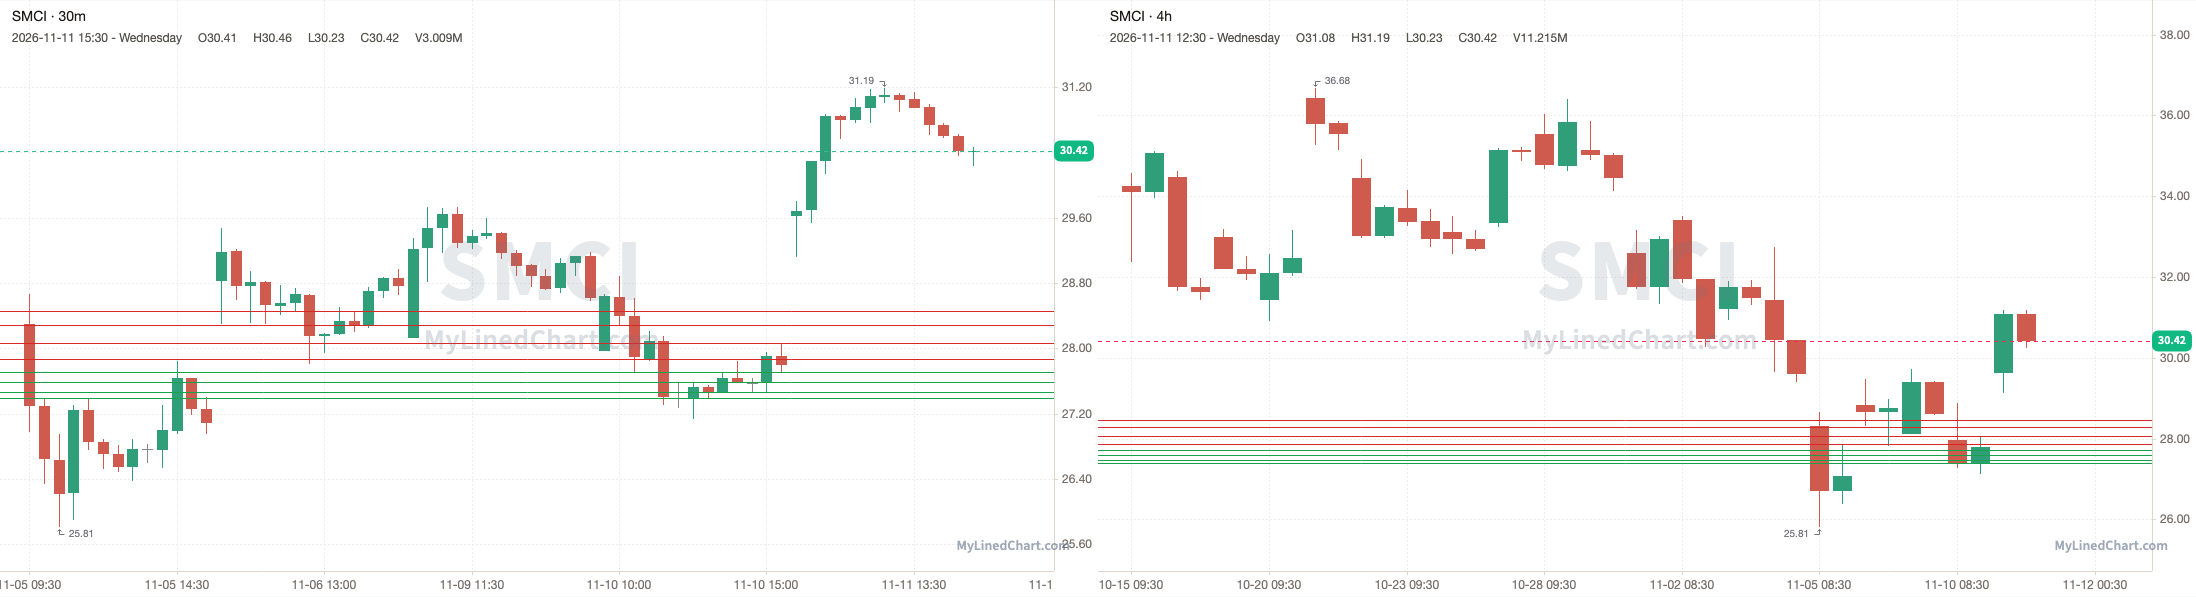
SMCI (Super Micro Computer)
SMCI opened at 29.62, over the 27.71 pivot and every level in the plan, and never traded back down to them, with a high of 31.19 and a low of 29.12, then ended up closing at 30.42. Finishing the trading session up 2.70% intraday and up 9.46% overall.
November 11th session levels:
All listed levels: 27.39, 27.46, 27.59, 27.71, 27.87, 28.06, 28.29, 28.46
Resistance above: 27.87, 28.06, 28.29, 28.46
Support below: 27.71, 27.59, 27.46, 27.39
Nearest pivot: 27.71
Above 27.87 → 28.06 next
Lose 27.71 → 27.59 next
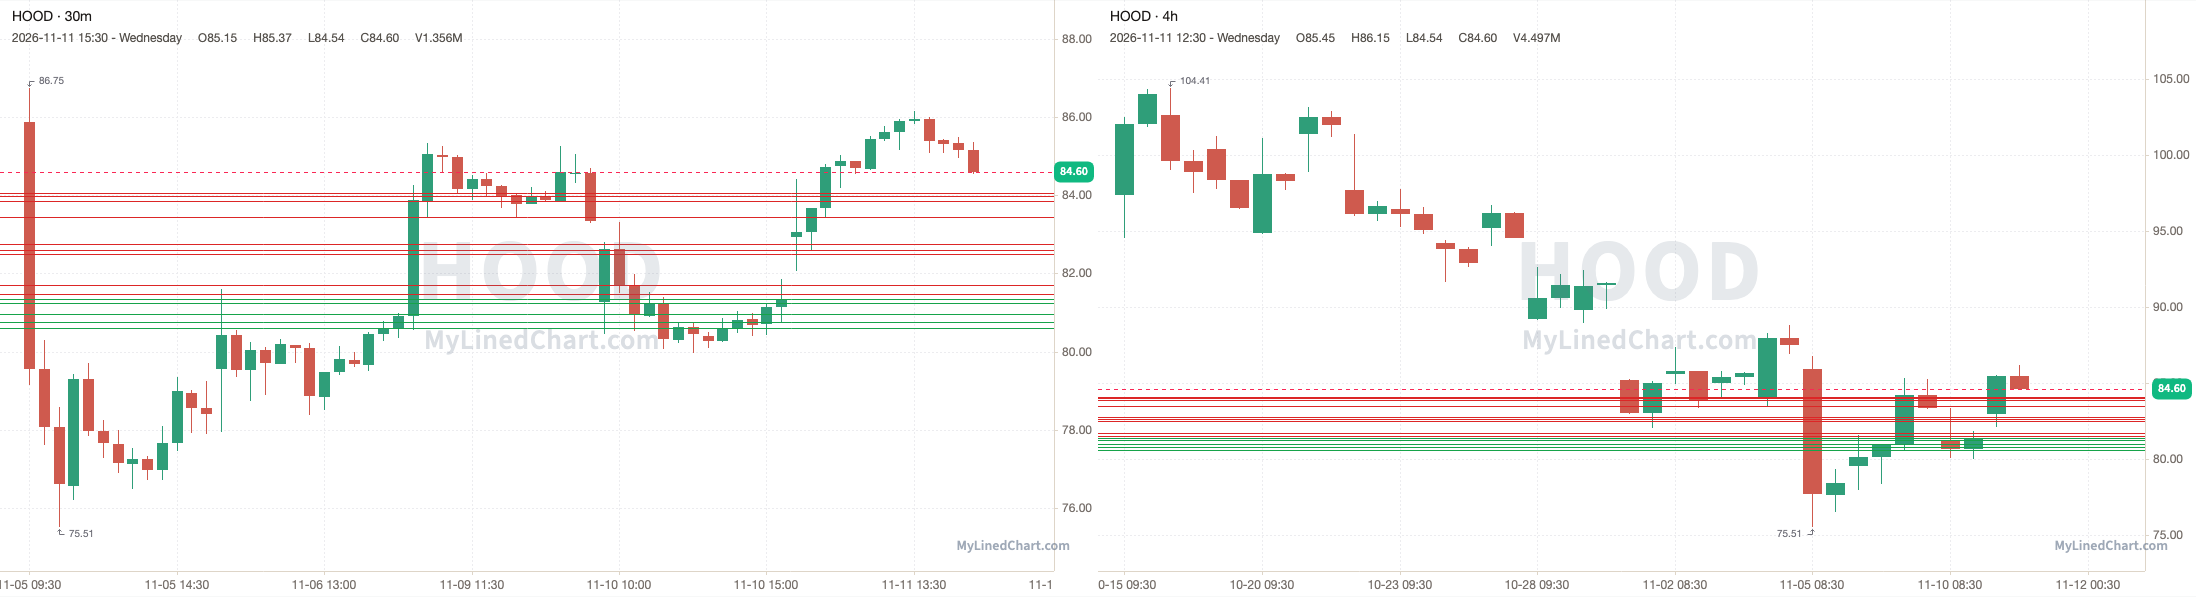
HOOD (Robinhood)
HOOD opened at 82.93, held above the 81.34 pivot and ran up to tag 84.06, with a high of 86.15, then ended up closing at 84.60. Finishing the trading session up 2.01% intraday and up 4.00% overall.
November 11th session levels:
All listed levels: 80.60, 80.77, 80.95, 81.24, 81.34, 81.48, 81.70, 82.50, 82.61, 82.76, 83.45, 83.86, 83.98, 84.06
Resistance above: 81.48, 81.70, 82.50, 82.61, 82.76, 83.45, 83.86, 83.98, 84.06
Support below: 81.34, 81.24, 80.95, 80.77, 80.60
Nearest pivot: 81.34
Above 81.48 → 81.70 next
Lose 81.34 → 81.24 next
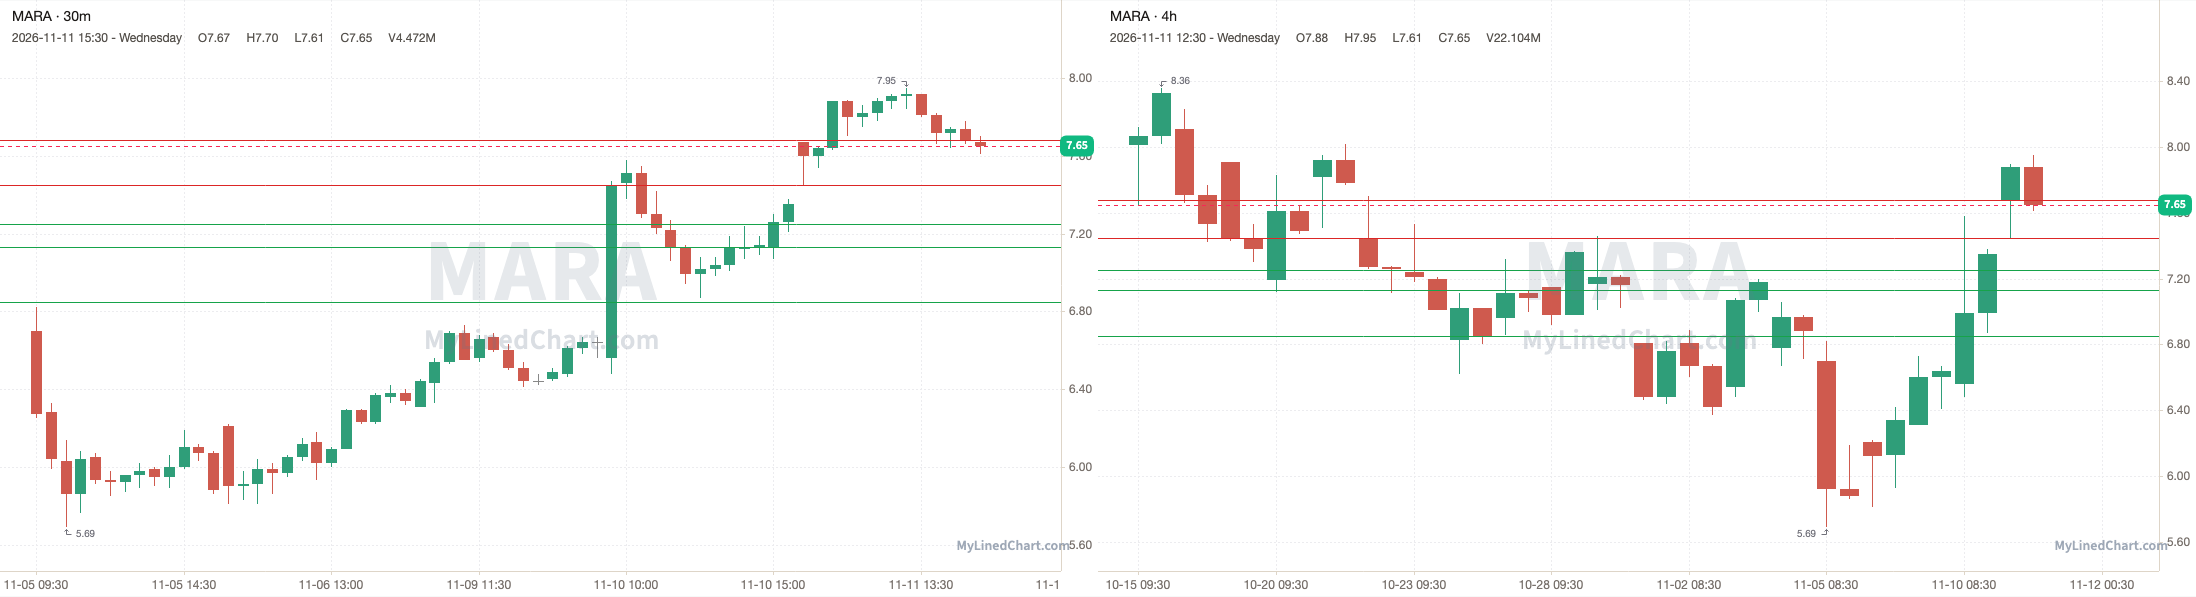
MARA (MARA Holdings)
MARA opened at 7.67, held above the 7.25 pivot and dropped to a low of 7.45, then ended up closing at 7.65. Finishing the trading session down 0.26% intraday and up 4.08% overall.
November 11th session levels:
All listed levels: 6.85, 7.13, 7.25, 7.45, 7.68
Resistance above: 7.45, 7.68
Support below: 7.25, 7.13, 6.85
Nearest pivot: 7.25
Above 7.45 → 7.68 next
Lose 7.25 → 7.13 next
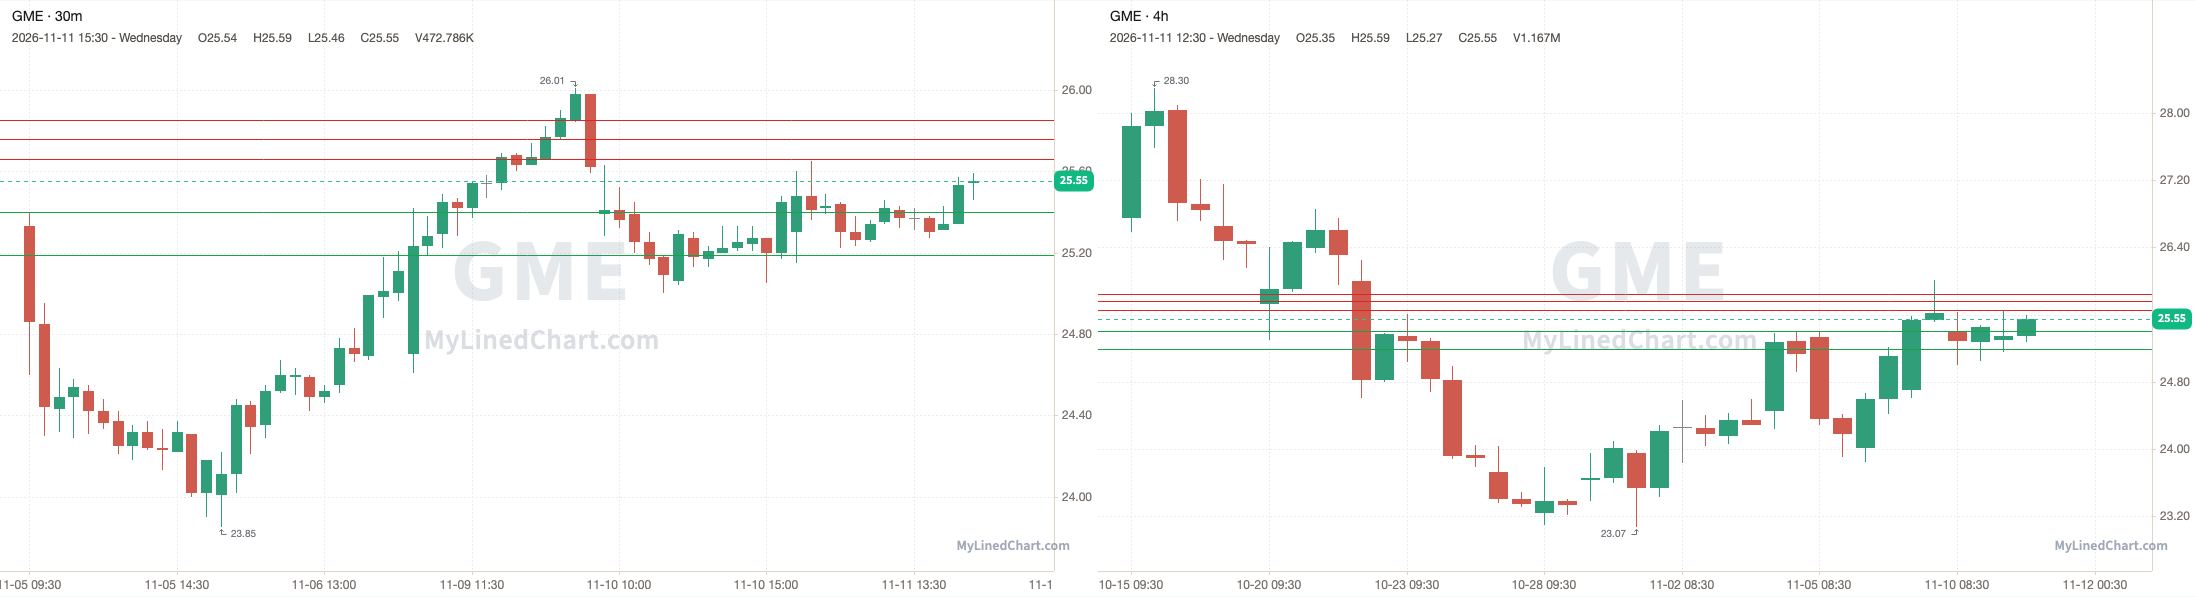
GME (GameStop)
GME opened at 25.30, broke above the 25.40 pivot and pushed to a high of 25.65, then ended up closing at 25.55. Finishing the trading session up 0.99% intraday and up 0.39% overall.
November 11th session levels:
All listed levels: 25.19, 25.40, 25.66, 25.76, 25.85
Resistance above: 25.66, 25.76, 25.85
Support below: 25.40, 25.19
Nearest pivot: 25.40
Above 25.66 → 25.76 next
Lose 25.40 → 25.19 next
IBIT (iShares Bitcoin Trust)
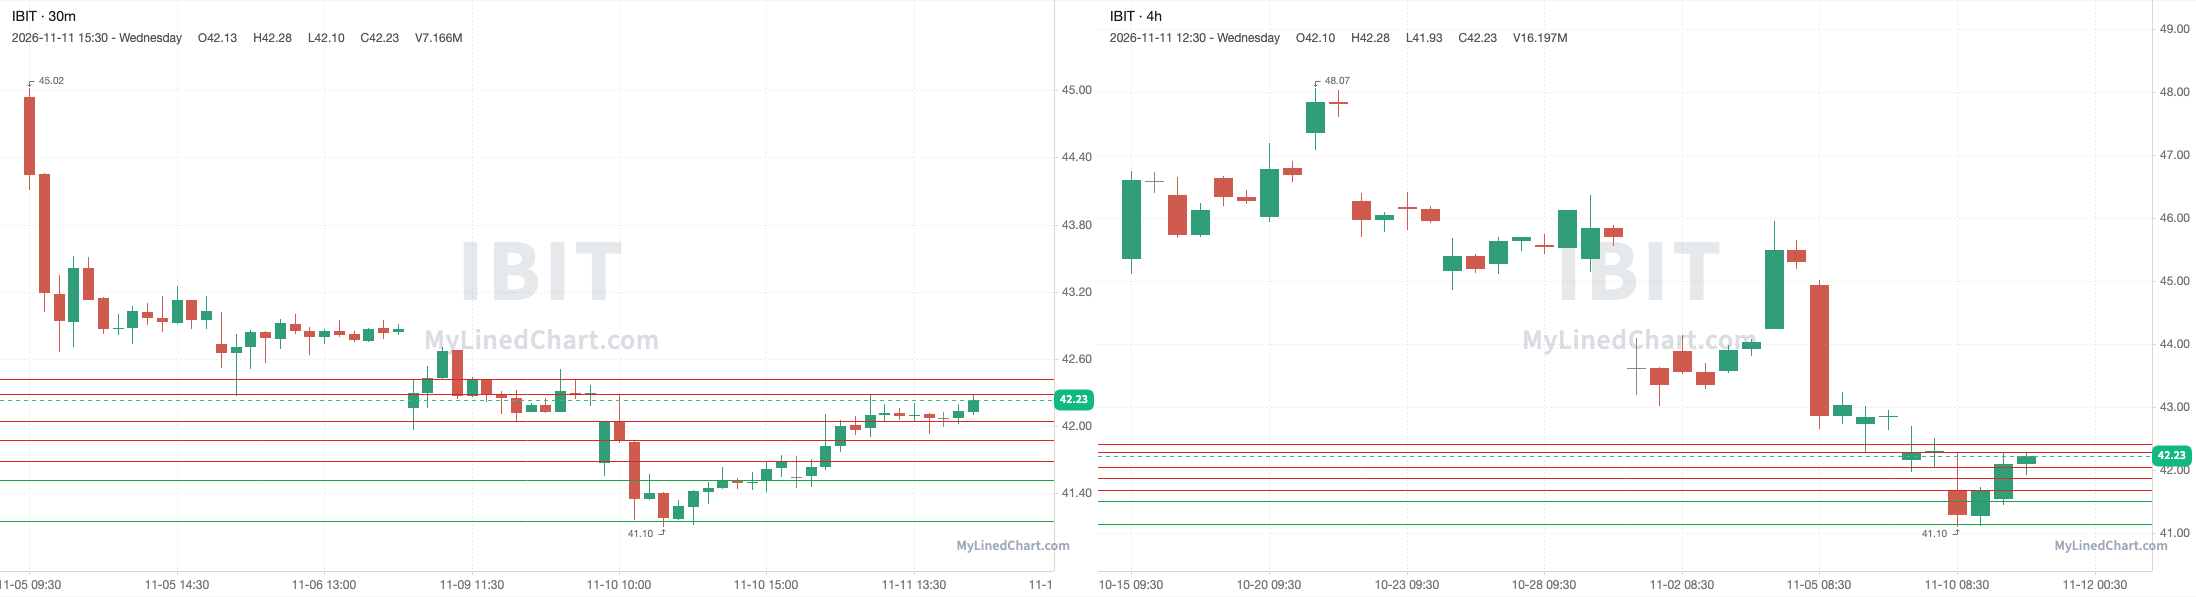
IBIT opened at 41.55, broke above the 41.69 pivot and ran up to tag 42.05, with a high of 42.28, then ended up closing at 42.23. Finishing the trading session up 1.64% intraday and up 1.30% overall.
November 11th session levels:
All listed levels: 41.15, 41.52, 41.69, 41.88, 42.05, 42.29, 42.42
Resistance above: 41.88, 42.05, 42.29, 42.42
Support below: 41.52, 41.15
Nearest pivot: 41.69
Above 41.88 → 42.05 next
Lose 41.52 → 41.15 next
ETHA (iShares Ethereum Trust)
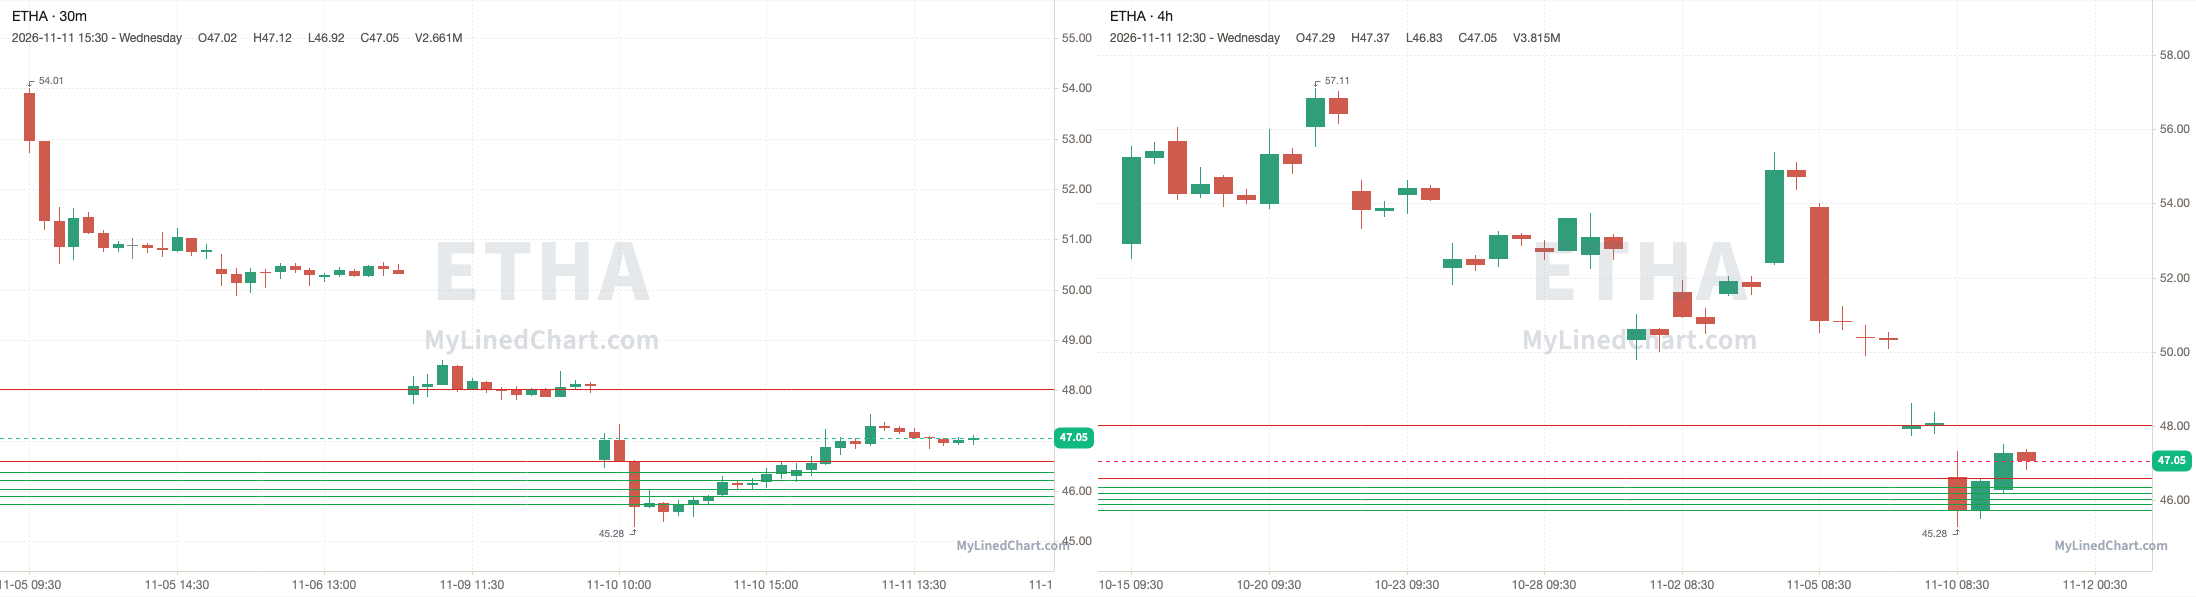
ETHA opened at 46.29, broke above the 46.60 pivot and pushed to a high of 47.52, then ended up closing at 47.05. Finishing the trading session up 1.64% intraday and up 1.16% overall.
November 11th session levels:
All listed levels: 45.73, 45.90, 46.03, 46.21, 46.37, 46.60, 48.03
Resistance above: 46.60, 48.03
Support below: 46.37, 46.21, 46.03, 45.90, 45.73
Nearest pivot: 46.60
Above 46.60 → 48.03 next
Lose 46.37 → 46.21 next
INTC (Intel)
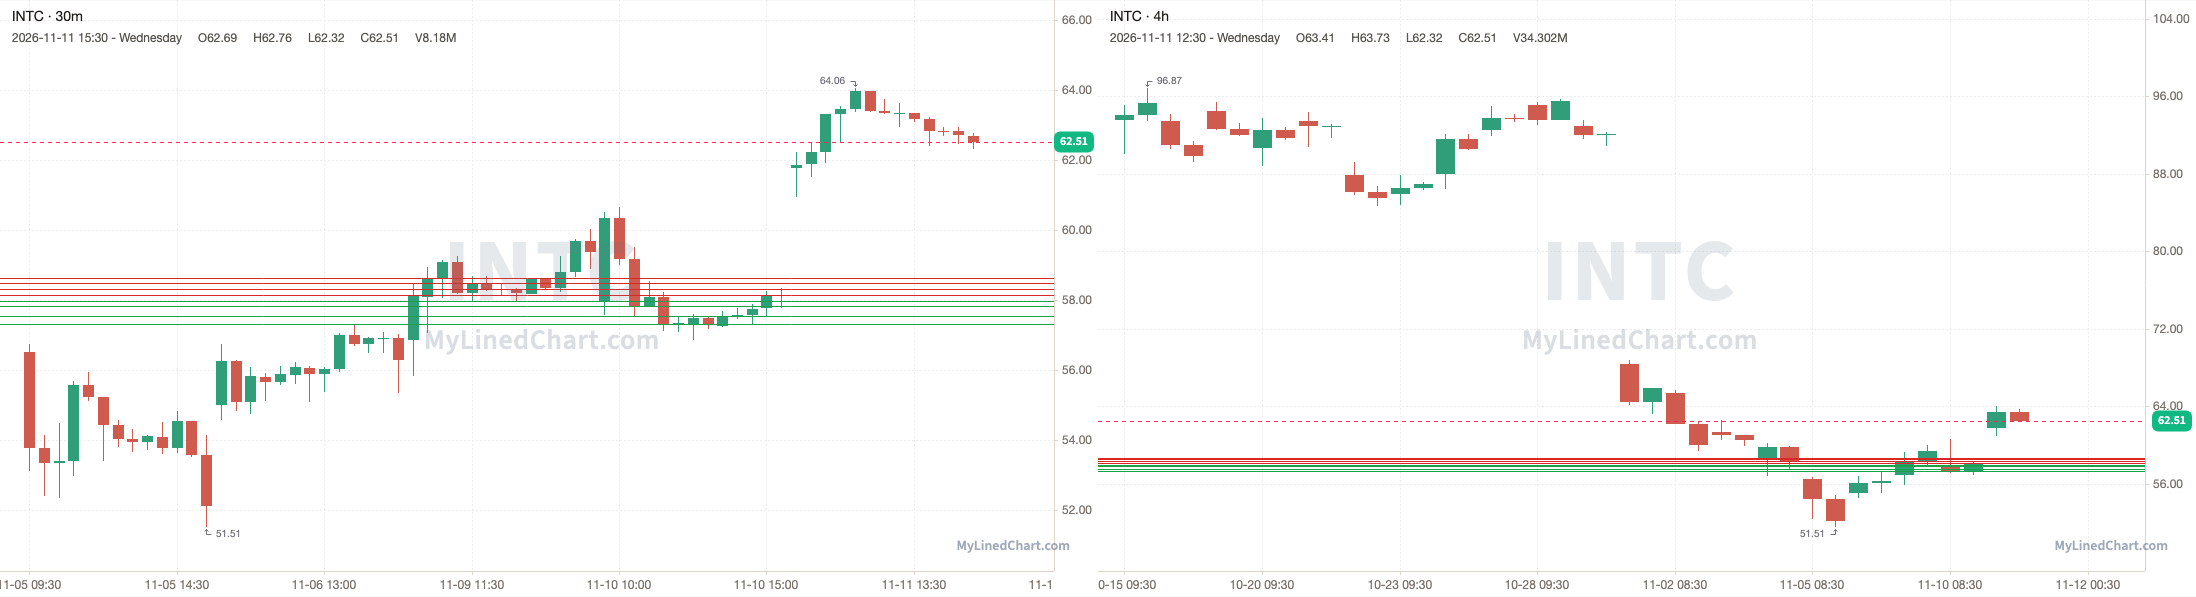
INTC opened at 61.77, over the 58.13 pivot and every level in the plan, and never traded back down to them, with a high of 64.06 and a low of 60.95, then ended up closing at 62.51. Finishing the trading session up 1.20% intraday and up 7.57% overall.
November 11th session levels:
All listed levels: 57.31, 57.53, 57.82, 57.97, 58.13, 58.30, 58.49, 58.64
Resistance above: 58.13, 58.30, 58.49, 58.64
Support below: 57.97, 57.82, 57.53, 57.31
Nearest pivot: 58.13
Above 58.13 → 58.30 next
Lose 57.97 → 57.82 next
RIVN (Rivian)
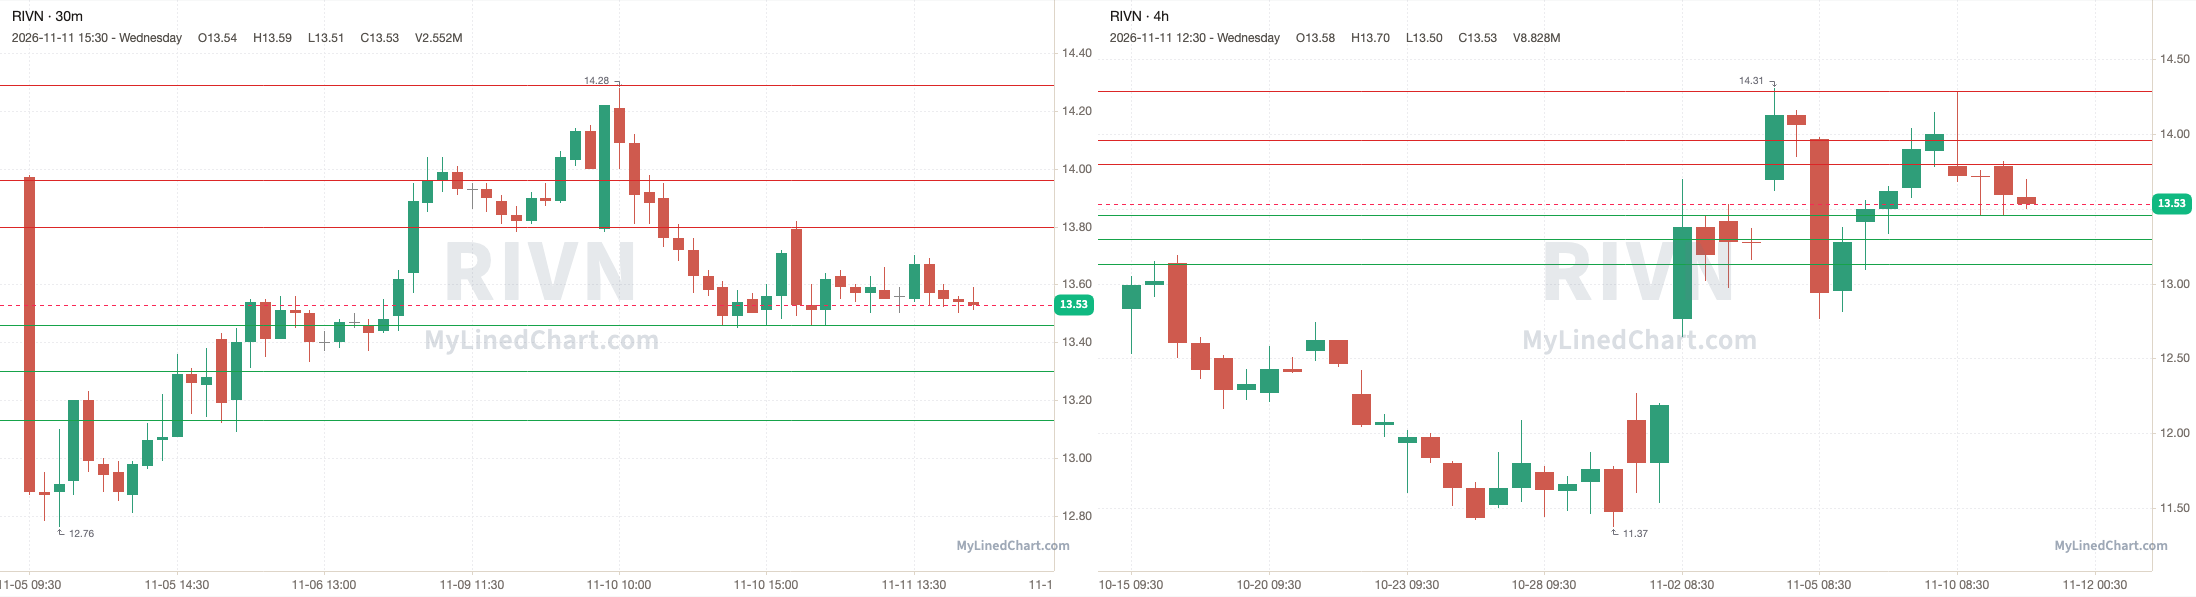
RIVN opened at 13.79, popped above the 13.80 pivot to a high of 13.82, then lost it and dropped to tag 13.46, with a low of 13.46, then ended up closing at 13.53. Finishing the trading session down 1.89% intraday and down 1.31% overall.
November 11th session levels:
All listed levels: 13.13, 13.30, 13.46, 13.80, 13.96, 14.29
Resistance above: 13.80, 13.96, 14.29
Support below: 13.46, 13.30, 13.13
Nearest pivot: 13.80
Above 13.80 → 13.96 next
Lose 13.46 → 13.30 next
Day Trade Levels for the November 12th Trading Session:
Disclaimer: Little Bird Trading and any of its associations may or may not, whether long or short, have a position in any instruments. Not investment advice. Provided for informational purposes only. Not a recommendation or endorsement. Not registered or licensed. Model portfolios are property of their respective owners. All data is sourced from publicly available information. No guarantee is being made or offered. Not responsible for financial loss or ruin. Little Bird Trading may earn a commission if you purchase through links on the site.