
US · SPY, ES, QQQ & NQ
SPY, ES, QQQ and NQ Support and Resistance, Pivots and Highest Volume Levels for Day Traders, Nov 13
Published · Lee H.
MyLinedChart works however you get to a trade: AI-Assisted, Discretionary, Quant, or Macro. Export your lines, levels plus the whole chart as XLSX, JSON, or CSV. Or, let AI do all the work for you.
Here’s an overview of how MyLinedChart compares to TradingView and TrendSpider. Available on Windows, Apple and Android.
Looking for a pro to build your trading workflows? Reach out on Upwork.
A recap of how the November 12th trading session and levels played out
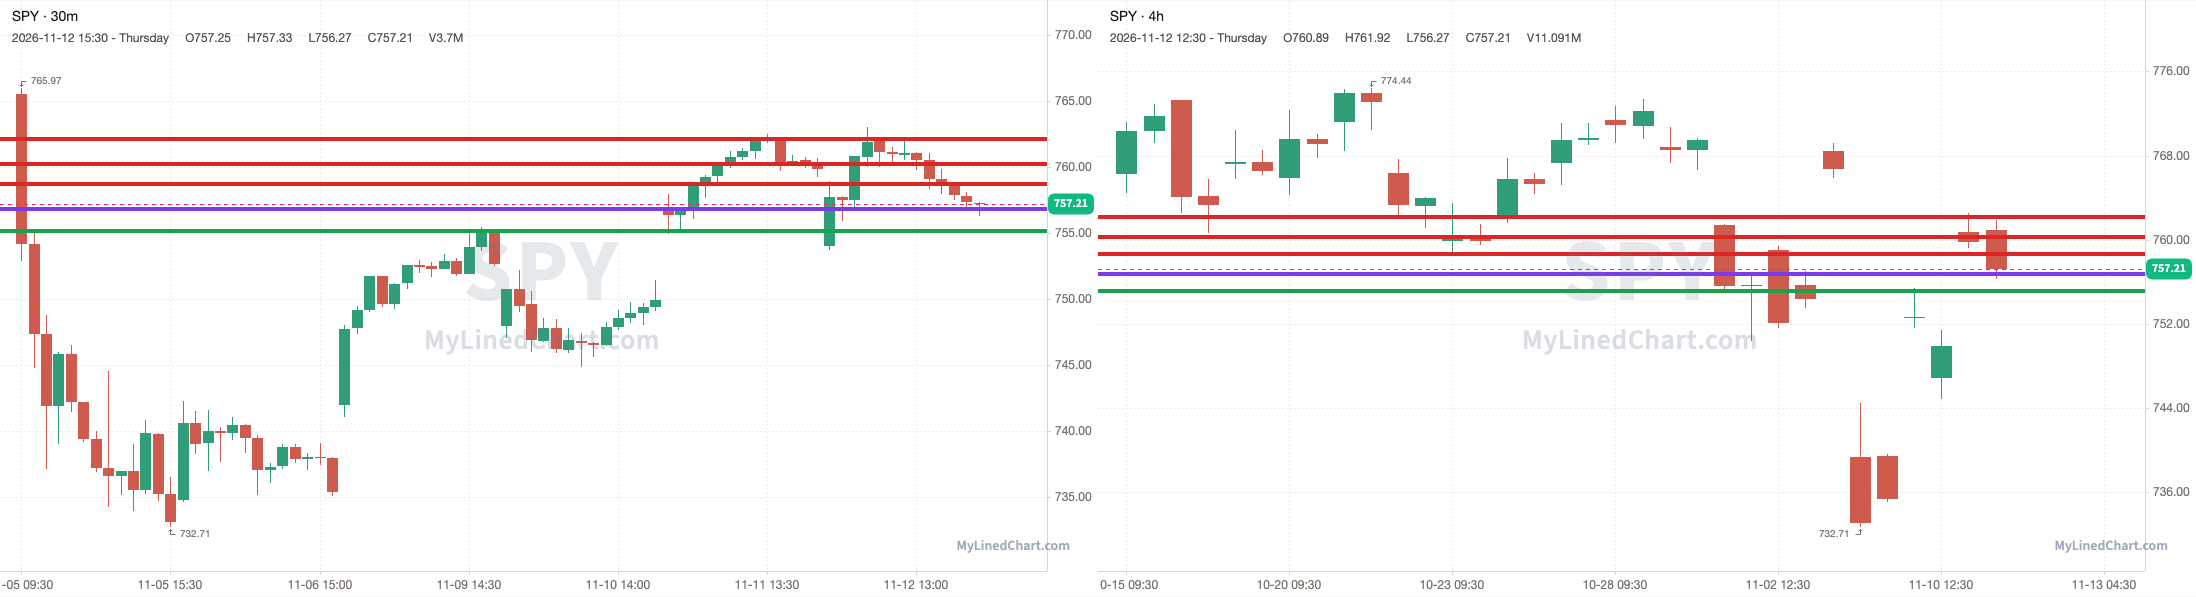
SPY opened at 753.99, broke above the 760.24 pivot and ran through every resistance level up to 762.13, and kept going to a high of 763.04, then ended up closing at 757.21. SPY finished up 0.43% intraday and down 0.34% overall.
SPY, November 12th session levels:
All listed levels: 755.16, 756.80, 758.69, 760.24, 762.13
Resistance above: 760.24, 762.13
Support below: 758.69, 756.80, 755.16
Nearest pivot: 760.24
Above 760.24 → 762.13 next
Lose 758.69 → 756.80 next
| Level | Touches | Close vs level |
|---|---|---|
| 762.13 | 1 | -4.92 |
| 760.24 | 2 | -3.03 |
| 758.69 | 3 | -1.48 |
| 756.80 | 2 | +0.41 |
| 755.16 | 1 | +2.05 |
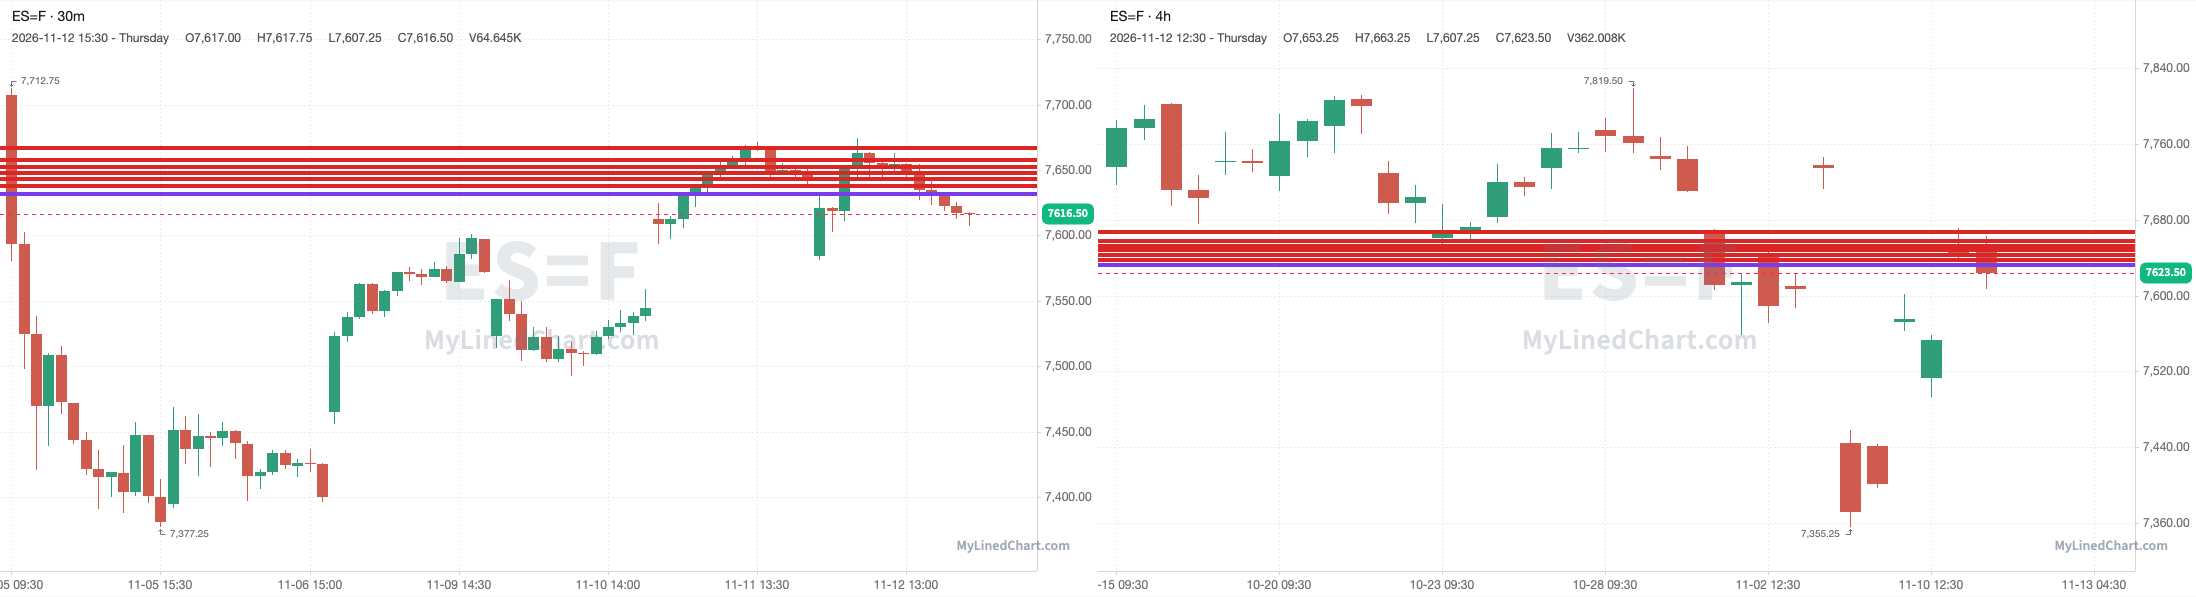
ES opened at 7584.25, broke above the 7643.25 pivot and ran through every resistance level up to 7667, and kept going to a high of 7674.50, then ended up closing at 7620.75. ES finished up 0.48% intraday and down 0.27% overall.
ES, November 12th session levels:
All listed levels: 7632, 7637.75, 7643.25, 7648, 7652.25, 7657.50, 7667
Resistance above: 7643.25, 7648, 7652.25, 7657.50, 7667
Support below: 7637.75, 7632
Nearest pivot: 7643.25
Above 7643.25 → 7648 next
Lose 7637.75 → 7632 next
| Level | Touches | Close vs level |
|---|---|---|
| 7667 | 1 | -46.25 |
| 7657.50 | 1 | -36.75 |
| 7652.25 | 1 | -31.50 |
| 7648 | 2 | -27.25 |
| 7643.25 | 2 | -22.50 |
| 7637.75 | 2 | -17 |
| 7632 | 3 | -11.25 |
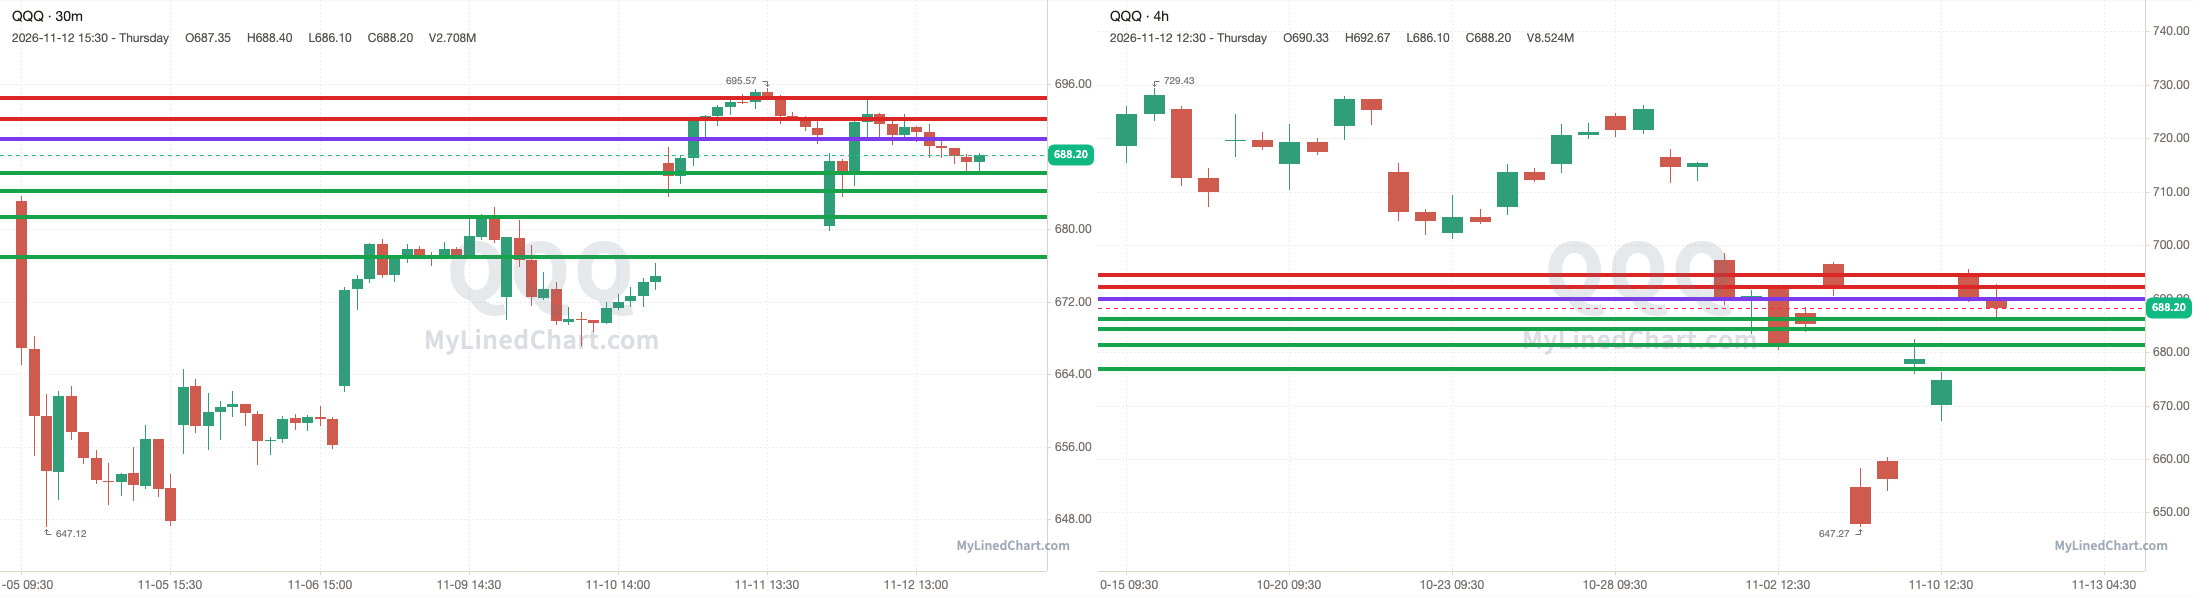
QQQ opened at 680.29, broke above the 689.89 pivot and ran through every resistance level up to 694.46, and kept going to a high of 694.56, then ended up closing at 688.20. QQQ finished up 1.16% intraday and down 0.32% overall.
QQQ, November 12th session levels:
All listed levels: 676.89, 681.35, 684.23, 686.18, 689.89, 692.09, 694.46
Resistance above: 692.09, 694.46
Support below: 689.89, 686.18, 684.23, 681.35, 676.89
Nearest pivot: 689.89
Above 692.09 → 694.46 next
Lose 689.89 → 686.18 next
| Level | Touches | Close vs level |
|---|---|---|
| 694.46 | 1 | -6.26 |
| 692.09 | 2 | -3.89 |
| 689.89 | 2 | -1.69 |
| 686.18 | 2 | +2.02 |
| 684.23 | 1 | +3.97 |
| 681.35 | 1 | +6.85 |
| 676.89 | 0 | +11.31 |
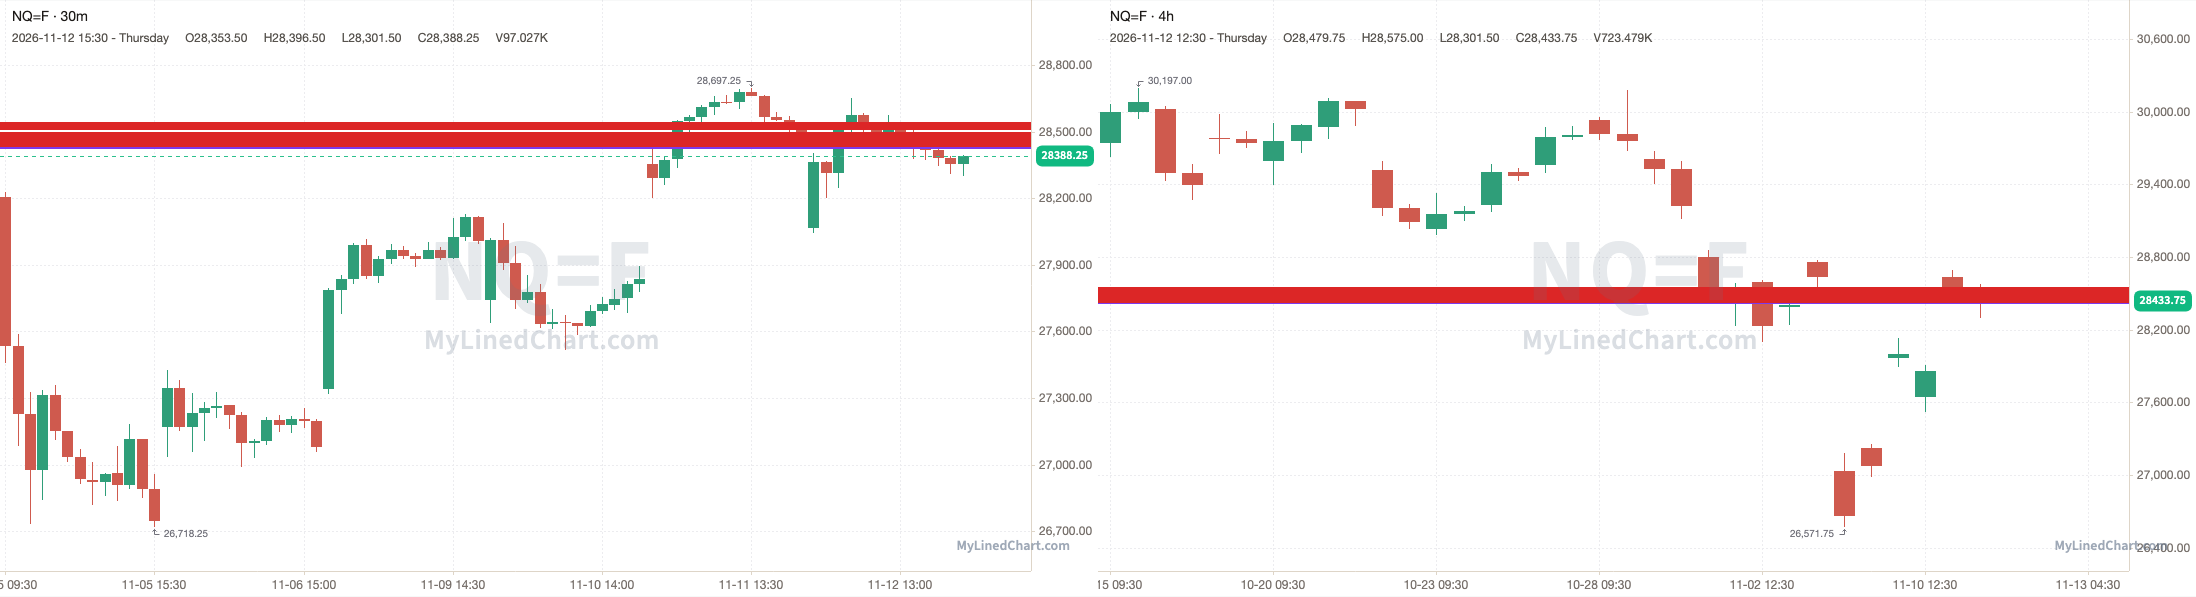
NQ opened at 28065.50, broke above the 28441.75 pivot and ran through every resistance level up to 28534.75, and kept going to a high of 28652.50, then ended up closing at 28398. NQ finished up 1.18% intraday and down 0.17% overall.
NQ, November 12th session levels:
All listed levels: 28431, 28441.75, 28456.75, 28473.25, 28484.25, 28490.50, 28518, 28534.75
Resistance above: 28456.75, 28473.25, 28484.25, 28490.50, 28518, 28534.75
Support below: 28441.75, 28431
Nearest pivot: 28441.75
Above 28456.75 → 28473.25 next
Lose 28441.75 → 28431 next
| Level | Touches | Close vs level |
|---|---|---|
| 28534.75 | 1 | -136.75 |
| 28518 | 1 | -120 |
| 28490.50 | 1 | -92.50 |
| 28484.25 | 1 | -86.25 |
| 28473.25 | 1 | -75.25 |
| 28456.75 | 2 | -58.75 |
| 28441.75 | 4 | -43.75 |
| 28431 | 3 | -33 |
Download these levels free for your own review and back testing: https://mylinedchart.com/resources/daily-levels/2026-11-12
Day Trade Levels for the November 13th Trading Session:
PPI day today.
Friday November 13: PPI for October (BLS) at 8:30 AM ET.
Day-trade levels for November 13th
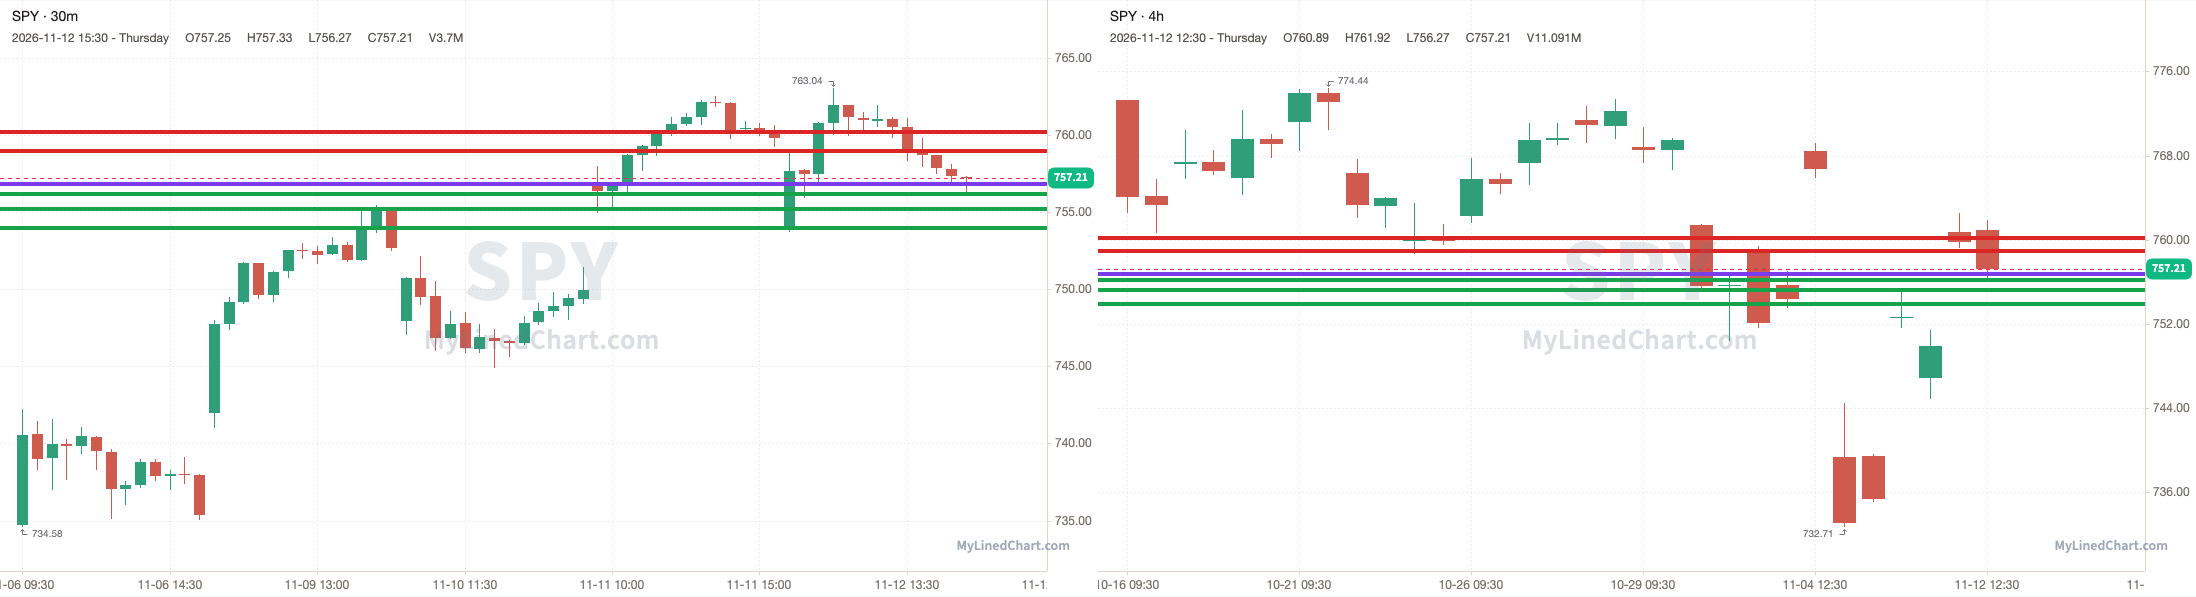
SPY closed at 757.21 on 11/12
All listed levels: 753.95, 755.19, 756.19, 756.79, 758.92, 760.20
Resistance above: 758.92, 760.20
Support below: 756.79, 756.19, 755.19, 753.95
Nearest pivot: 756.79
Above 758.92 → 760.20 next
Lose 756.79 → 756.19 next
Bull path: SPY holds above the 756.79 pivot and works toward 758.92 then 760.20.
Bear path: SPY loses the 756.79 pivot and works toward 756.19 then 755.19.
The lean is on the bull path, with the 757.21 close above the 756.79 pivot. A move below 756.79 flips the lean to the bear path.
SPY daily and weekly floor pivots from regular-hours high, low and close, with the distance from the 757.21 close.
| Pivot | Price | From the close |
|---|---|---|
| Weekly R1 | 766.49 | +9.28 |
| Weekly P | 753.76 | -3.45 |
| Weekly S1 | 744.47 | -12.74 |
ES levels on SPY: each ES level divided by the ES to SPY ratio at the close (10.0642), as a cross-check against the SPY levels.
| ES level | On SPY |
|---|---|
| 7643 | 759.42 |
| 7638.25 | 758.95 |
| 7632 | 758.33 |
| 7626.75 | 757.81 |
| 7622.50 | 757.38 |
| 7617.75 | 756.91 |
| 7612.50 | 756.39 |
| 7597.75 | 754.92 |
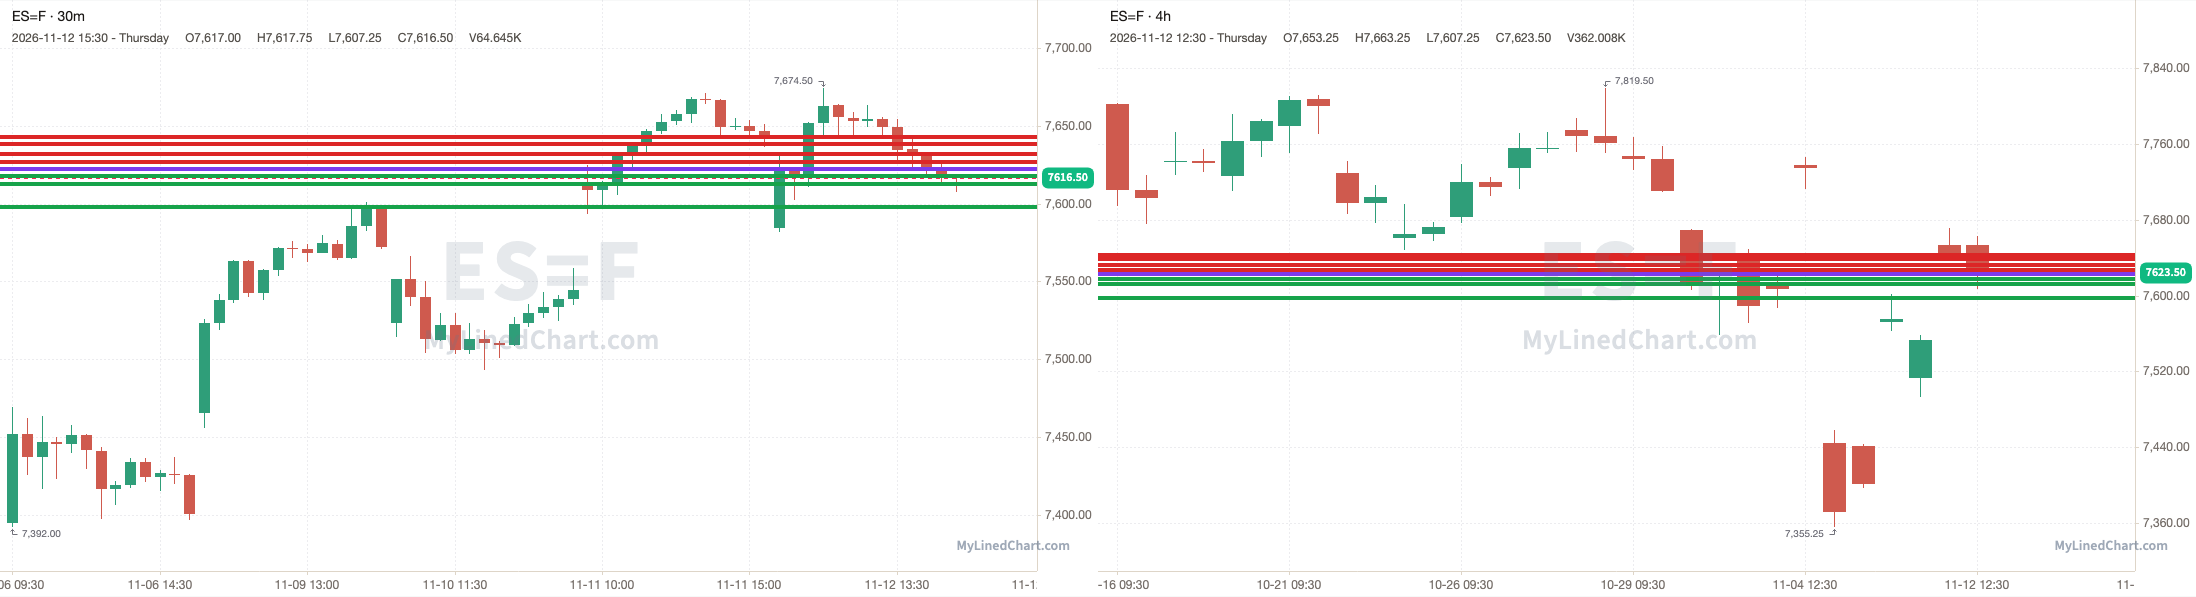
ES closed at 7620.75 on 11/12
All listed levels: 7597.75, 7612.50, 7617.75, 7622.50, 7626.75, 7632, 7638.25, 7643
Resistance above: 7622.50, 7626.75, 7632, 7638.25, 7643
Support below: 7617.75, 7612.50, 7597.75
Nearest pivot: 7622.50
Above 7622.50 → 7626.75 next
Lose 7617.75 → 7612.50 next
Bull path: ES holds above the 7622.50 pivot and works toward 7626.75 then 7632.
Bear path: ES loses the 7622.50 pivot and works toward 7617.75 then 7612.50.
The lean is on the bear path, with the 7620.75 close below the 7622.50 pivot. A move above 7622.50 flips the lean to the bull path.
ES daily and weekly floor pivots from regular-hours high, low and close, with the distance from the 7620.75 close.
| Pivot | Price | From the close |
|---|---|---|
| Weekly R1 | 7711.50 | +90.75 |
| Weekly P | 7583.75 | -37 |
| Weekly S1 | 7493 | -127.75 |
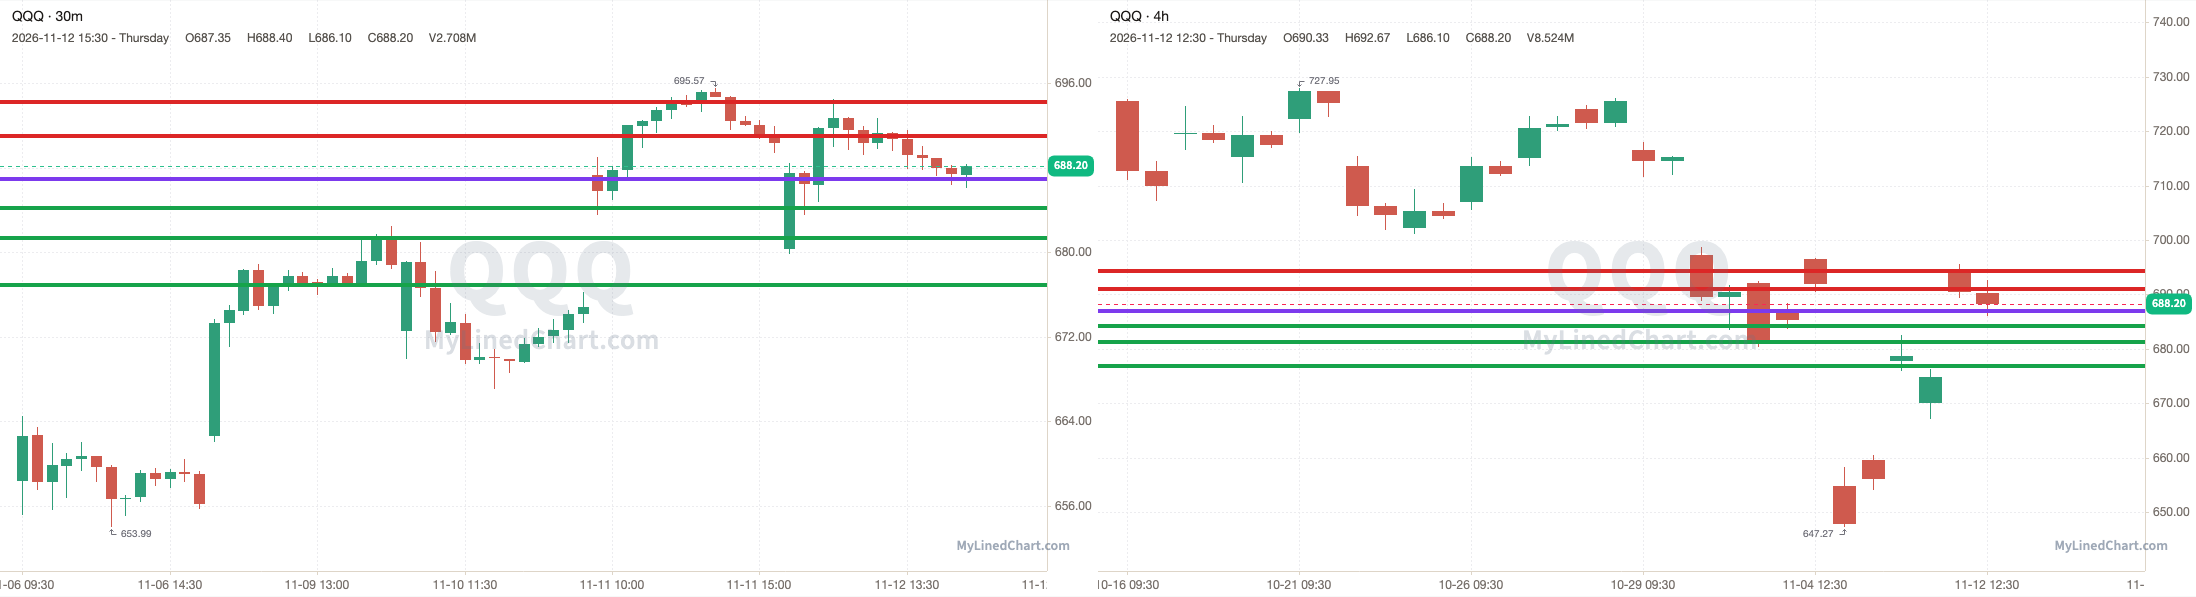
QQQ closed at 688.20 on 11/12
All listed levels: 676.89, 681.35, 684.22, 686.95, 691.03, 694.25
Resistance above: 691.03, 694.25
Support below: 686.95, 684.22, 681.35, 676.89
Nearest pivot: 686.95
Above 691.03 → 694.25 next
Lose 686.95 → 684.22 next
Bull path: QQQ holds above the 686.95 pivot and works toward 691.03 then 694.25.
Bear path: QQQ loses the 686.95 pivot and works toward 684.22 then 681.35.
The lean is on the bull path, with the 688.20 close above the 686.95 pivot. A move below 686.95 flips the lean to the bear path.
QQQ daily and weekly floor pivots from regular-hours high, low and close, with the distance from the 688.20 close.
| Pivot | Price | From the close |
|---|---|---|
| Weekly R1 | 701.84 | +13.64 |
| Weekly P | 681.93 | -6.27 |
| Weekly S1 | 668.29 | -19.91 |
NQ levels on QQQ: each NQ level divided by the NQ to QQQ ratio at the close (41.2642), as a cross-check against the QQQ levels.
| NQ level | On QQQ |
|---|---|
| 28421 | 688.76 |
| 28418 | 688.68 |
| 28407 | 688.42 |
| 28398.75 | 688.22 |
| 28396.75 | 688.17 |
| 28394.50 | 688.12 |
| 28391.25 | 688.04 |
| 28388.25 | 687.96 |
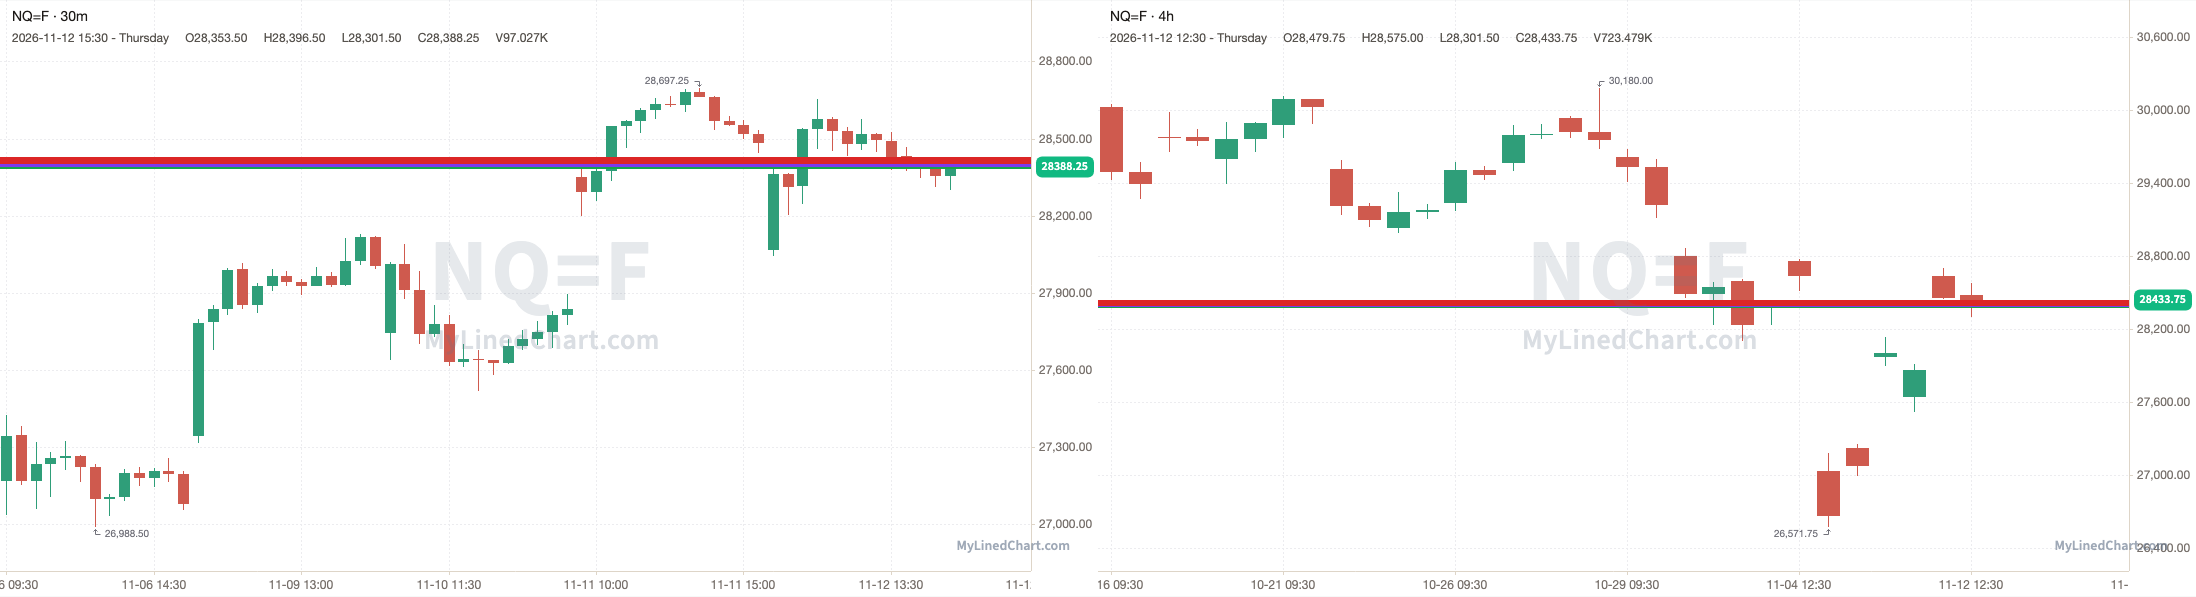
NQ closed at 28398.00 on 11/12
All listed levels: 28388.25, 28391.25, 28394.50, 28396.75, 28398.75, 28407, 28418, 28421
Resistance above: 28398.75, 28407, 28418, 28421
Support below: 28396.75, 28394.50, 28391.25, 28388.25
Nearest pivot: 28398.75
Above 28398.75 → 28407 next
Lose 28396.75 → 28394.50 next
Bull path: NQ holds above the 28398.75 pivot and works toward 28407 then 28418.
Bear path: NQ loses the 28398.75 pivot and works toward 28396.75 then 28394.50.
The lean is on the bear path, with the 28398 close below the 28398.75 pivot. A move above 28398.75 flips the lean to the bull path.
NQ daily and weekly floor pivots from regular-hours high, low and close, with the distance from the 28398 close.
| Pivot | Price | From the close |
|---|---|---|
| Weekly R1 | 28958.25 | +560.25 |
| Weekly P | 28137 | -261 |
| Weekly S1 | 27576.75 | -821.25 |
Don't want to wait until just before the open? Pro gets these levels about 1 hour after the close.
Pro also adds how many times price touched each level and the volume traded at that level.
Upgrade to Pro: https://littlebirdtrading.com/pricing
Touches and volume
Get touches and volumeThese levels arrive about 1 hour after the close, with touches and volume at every level.
✓ Every symbol with All Access✓ Sent to your inbox✓ MyLinedChart levels for your own rules and journaling
Disclaimer: Little Bird Trading and any of its associations may or may not, whether long or short, have a position in any instruments. Not investment advice. Provided for informational purposes only. Not a recommendation or endorsement. Not registered or licensed. Model portfolios are property of their respective owners. All data is sourced from publicly available information. No guarantee is being made or offered. Not responsible for financial loss or ruin. Little Bird Trading may earn a commission if you purchase through links on the site.