 Little Bird Trading
 FTSE MIB: October 6th Trade Plan Plus Charts
By Lee H. · · 1 min read
MyLinedChart works however you get to a trade: AI-Assisted, Discretionary, Quant, or Macro. Export your lines, levels plus the whole chart as XLSX, JSON, or CSV. Or, let AI do all the work for you.
Here’s an overview of how MyLinedChart compares to TradingView and TrendSpider. Available on Windows, Apple and Android.
Looking for a pro to build your trading workflows? Reach out on Upwork.
A recap of how the October 5th FTSE MIB trading session and levels played out:
FTSE MIB opened at 50300, dipped below the 50160 pivot to a low of 50065, then reclaimed it and ran through every resistance level up to 50335, and kept going to a high of 50615, then ended up closing at 50500. Finishing the trading session up 0.40% intraday.
October 5th session levels:
All listed levels: 49890, 50020, 50160, 50335
Resistance above: 50160, 50335
Support below: 50020, 49890
Nearest pivot: 50160
Above 50160 → 50335 next
Lose 50020 → 49890 next
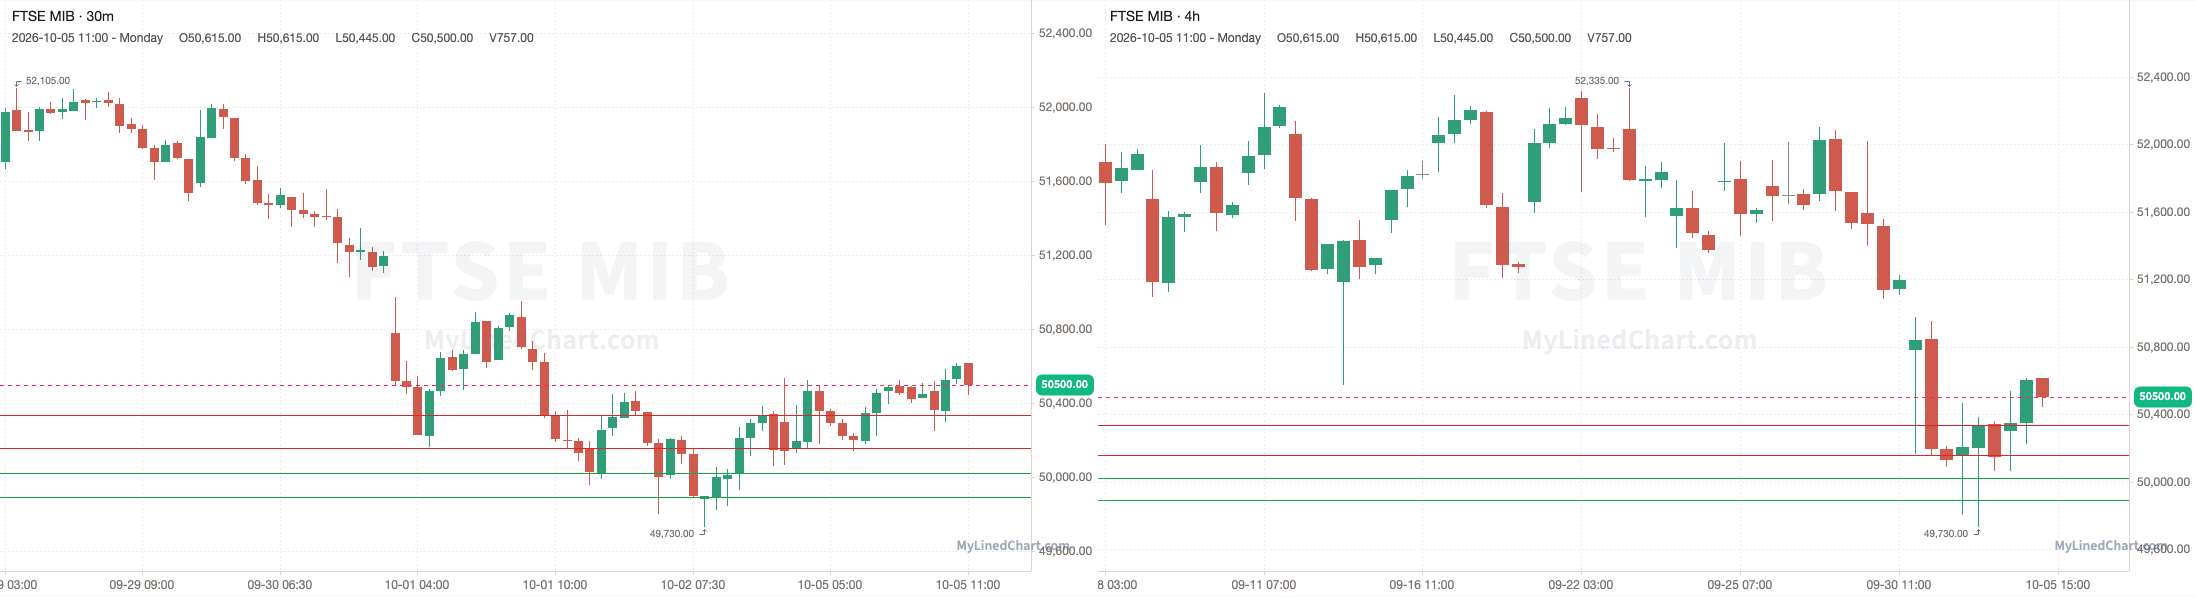
Download these levels free for your own review and back testing: https://mylinedchart.com/resources/daily-levels/2026-10-05/it
Day Trade Levels for the October 6th Trading Session:
Disclaimer: Little Bird Trading and any of its associations may or may not, whether long or short, have a position in any instruments. Not investment advice. Provided for informational purposes only. Not a recommendation or endorsement. Not registered or licensed. Model portfolios are property of their respective owners. All data is sourced from publicly available information. No guarantee is being made or offered. Not responsible for financial loss or ruin. Little Bird Trading may earn a commission if you purchase through links on the site.