
SPY, ES Day Trade Levels: Oct 12-16 Week in Review and Chart Pack
Published · Lee H.
A red week: all 4 finished lower, with the week's low on Friday, October 16.
How each one played out
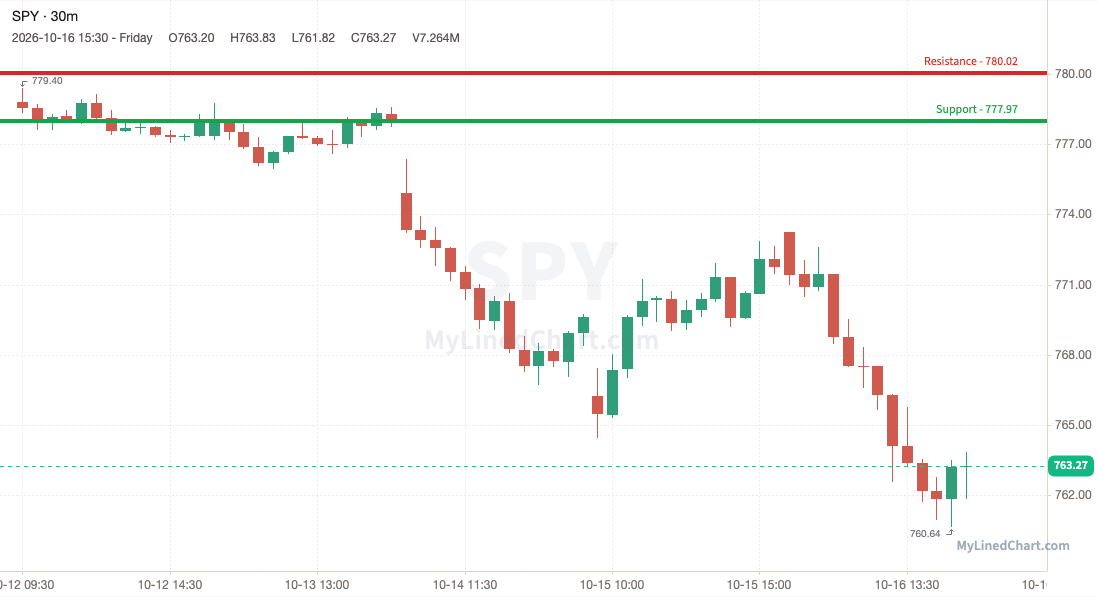
SPY (S&P 500 ETF) -1.99%
SPY broke the 777.97 support and couldn't get back above it, closing at 763.27, near the week's low.
Busiest levels this week:
SPY 780.02: most volume, 3393016 shares, touched 12 times
SPY 776.90: 2nd most, 1665360 shares, touched 19 times
SPY 777.97: 3rd most, 1555406 shares, touched 17 times
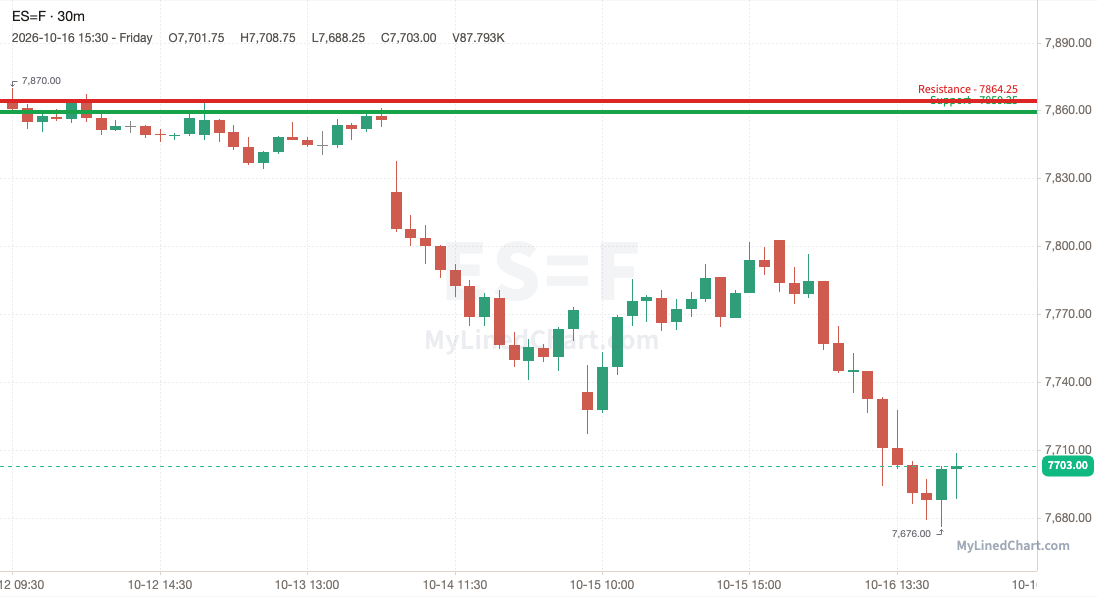
ES (E-mini S&P 500 futures) -2.04%
ES lost 7859.25 and stayed under it, ending the week at 7702.50, down at the lows.
Busiest levels this week:
ES 7855: most volume, 58643 contracts, touched 13 times
ES 7878.25: 2nd most, 47841 contracts, touched 11 times
ES 7864.25: 3rd most, 27527 contracts, touched 9 times
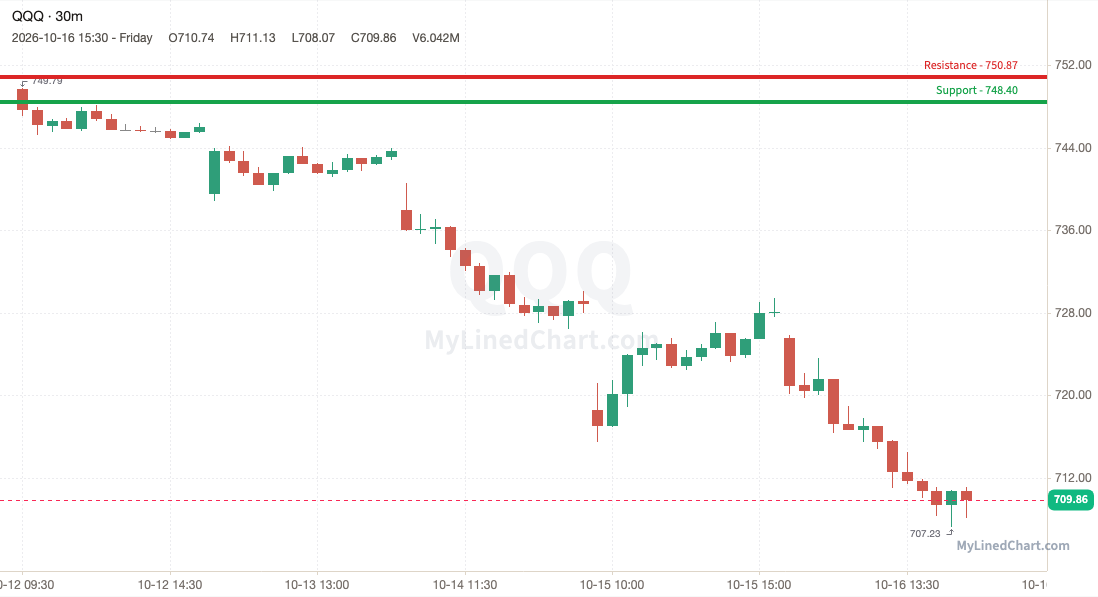
QQQ (Nasdaq 100 ETF) -5.31%
The 748.40 support gave way for QQQ, which closed below it at 709.86, at the bottom of its weekly range.
Busiest levels this week:
QQQ 741.44: most volume, 10756881 shares, touched 41 times
QQQ 747.67: 2nd most, 6312477 shares, touched 28 times
QQQ 753.34: 3rd most, 5660766 shares, touched 19 times
NQ (E-mini Nasdaq 100 futures) -5.36%
NQ broke the 30975.50 support and couldn't get back above it, closing at 29381.50, near the week's low.
Busiest levels this week:
NQ 30891.50: most volume, 54785 contracts, touched 10 times
NQ 30896.50: 2nd most, 26687 contracts, touched 5 times
NQ 31108: 3rd most, 24573 contracts, touched 5 times
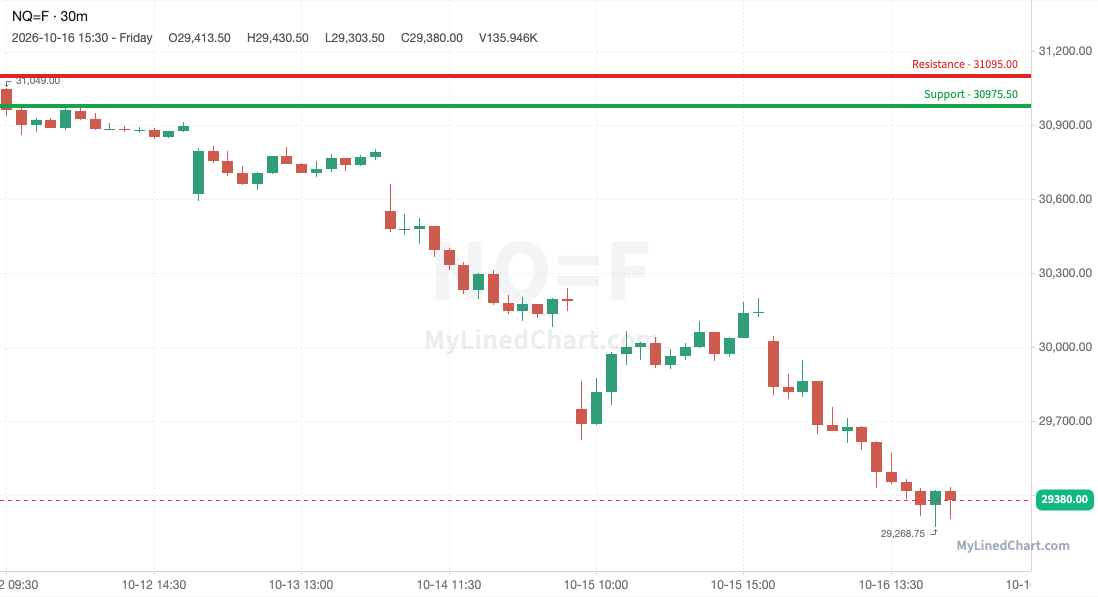
Touches show how often traders defended a price; each test can wear it down. Volume shows how much trading happened there, and heavy-volume prices tend to pull price back because many traders hold positions there.
Levels for the week ahead
SPY
SPY closed the week at 763.27. For the week ahead the weekly pivot is 767.77, with R1 at 774.90 and S1 at 756.14. Last week's range ran from 760.64 to 779.40.
| Weekly level | Price | From the close |
|---|---|---|
| Last week high | 779.40 | +16.13 |
| Weekly R1 | 774.90 | +11.63 |
| Weekly pivot | 767.77 | +4.50 |
| Last week low | 760.64 | -2.63 |
| Weekly S1 | 756.14 | -7.13 |
ES
ES closed the week at 7702.50. For the week ahead the weekly pivot is 7749.50, with R1 at 7823 and S1 at 7629. Last week's range ran from 7676 to 7870.
| Weekly level | Price | From the close |
|---|---|---|
| Last week high | 7870 | +167.50 |
| Weekly R1 | 7823 | +120.50 |
| Weekly pivot | 7749.50 | +47 |
| Last week low | 7676 | -26.50 |
| Weekly S1 | 7629 | -73.50 |
QQQ
QQQ closed the week at 709.86. For the week ahead the weekly pivot is 722.29, with R1 at 737.36 and S1 at 694.80. Last week's range ran from 707.23 to 749.79.
| Weekly level | Price | From the close |
|---|---|---|
| Last week high | 749.79 | +39.93 |
| Weekly R1 | 737.36 | +27.50 |
| Weekly pivot | 722.29 | +12.43 |
| Last week low | 707.23 | -2.63 |
| Weekly S1 | 694.80 | -15.06 |
NQ
NQ closed the week at 29381.50. For the week ahead the weekly pivot is 29899.75, with R1 at 30530.75 and S1 at 28750.50. Last week's range ran from 29268.75 to 31049.
| Weekly level | Price | From the close |
|---|---|---|
| Last week high | 31049 | +1667.50 |
| Weekly R1 | 30530.75 | +1149.25 |
| Weekly pivot | 29899.75 | +518.25 |
| Last week low | 29268.75 | -112.75 |
| Weekly S1 | 28750.50 | -631 |
US market calendar for the week of October 19 to 23
The US calendar for the week of October 19 to 23 has no scheduled major releases.
See the latest daily SPY, ES, QQQ & NQ levels, posted the evening before the next day's session.
MyLinedChart turns your technical analysis into trading rules. Draw your levels, export your entire chart to XLSX, and turn your rules into trades. Or, have Claude, Codex, or Cursor do the work for you.
Not financial advice. Objective market structure and levels only. You make and own your trades.