
SPY, ES Day Trade Levels: Oct 19-23 Week in Review and Chart Pack
Published · Lee H.
A red week: all 4 finished lower, with the week's low on Friday, October 23.
How each one played out
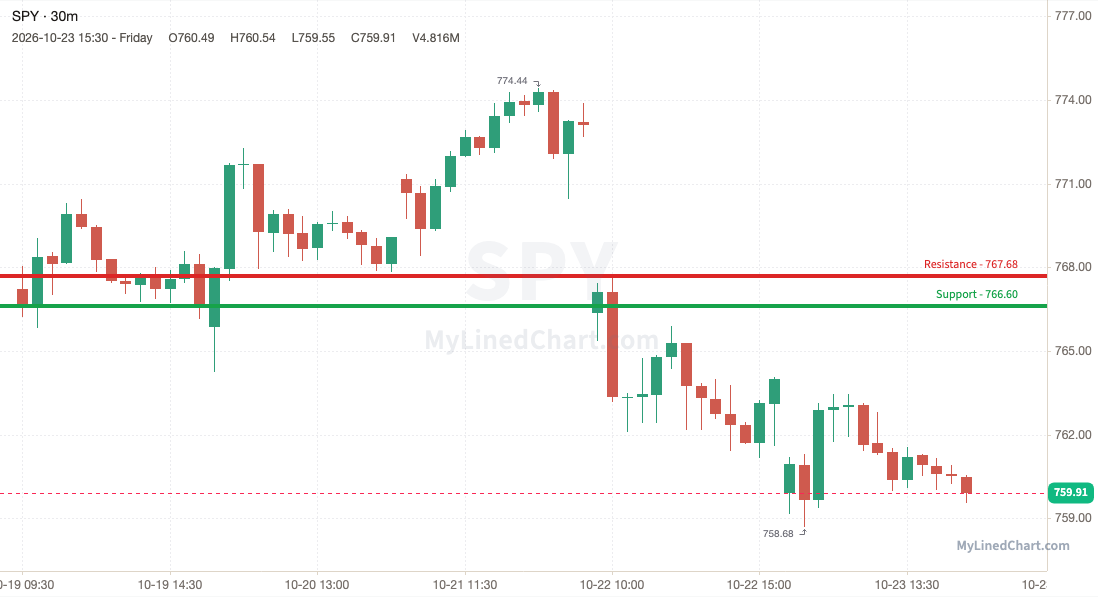
SPY (S&P 500 ETF) -0.95%
SPY lost 766.60 and stayed under it, ending the week at 759.91, down at the lows.
Busiest levels this week:
SPY 773.33: most volume, 9661112 shares, touched 47 times
SPY 767.68: 2nd most, 5609485 shares, touched 22 times
SPY 769.68: 3rd most, 5004418 shares, touched 23 times
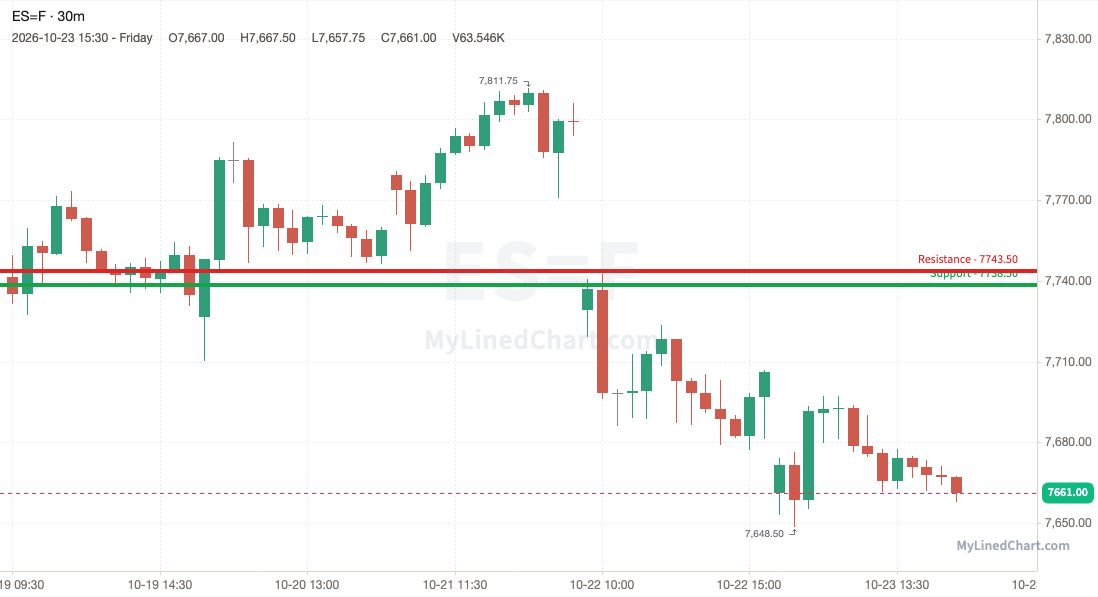
ES (E-mini S&P 500 futures) -0.89%
The 7738.50 support gave way for ES, which closed below it at 7672.25, at the bottom of its weekly range.
Busiest levels this week:
ES 7802.25: most volume, 154294 contracts, touched 28 times
ES 7806.50: 2nd most, 144082 contracts, touched 27 times
ES 7743.50: 3rd most, 82662 contracts, touched 13 times
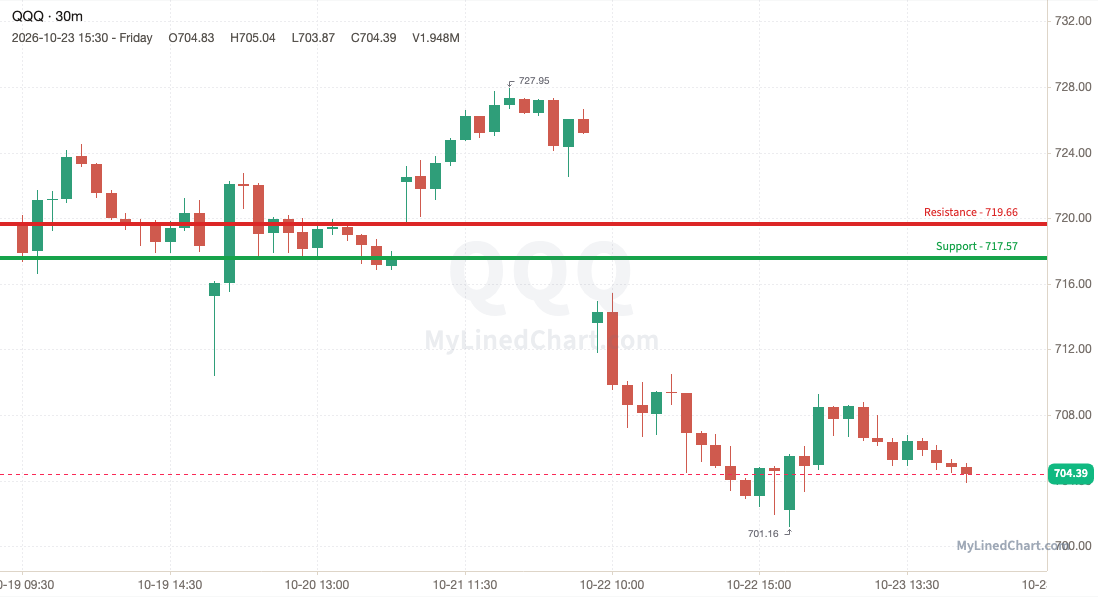
QQQ (Nasdaq 100 ETF) -2.11%
QQQ broke the 717.57 support and couldn't get back above it, closing at 704.39, near the week's low.
Busiest levels this week:
QQQ 719.66: most volume, 7049919 shares, touched 27 times
QQQ 721.80: 2nd most, 5205484 shares, touched 23 times
QQQ 717.57: 3rd most, 4745171 shares, touched 20 times
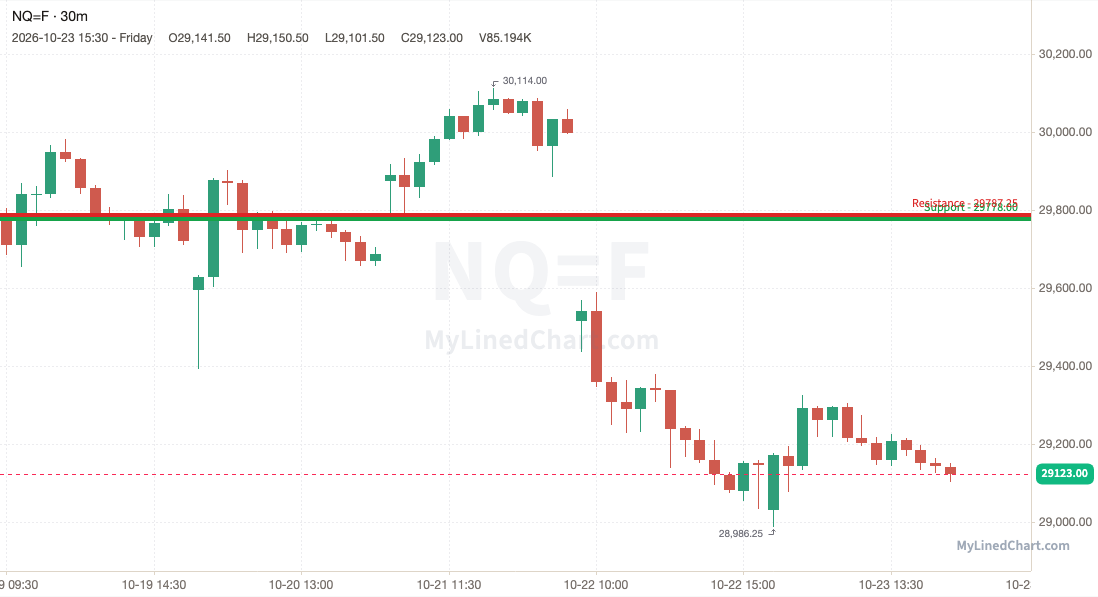
NQ (E-mini Nasdaq 100 futures) -2.02%
NQ lost 29778 and stayed under it, ending the week at 29177, down at the lows.
Busiest levels this week:
NQ 29735.50: most volume, 62248 contracts, touched 5 times
NQ 29740.25: 2nd most, 58827 contracts, touched 14 times
NQ 29727.50: 3rd most, 53524 contracts, touched 13 times
Active Traders
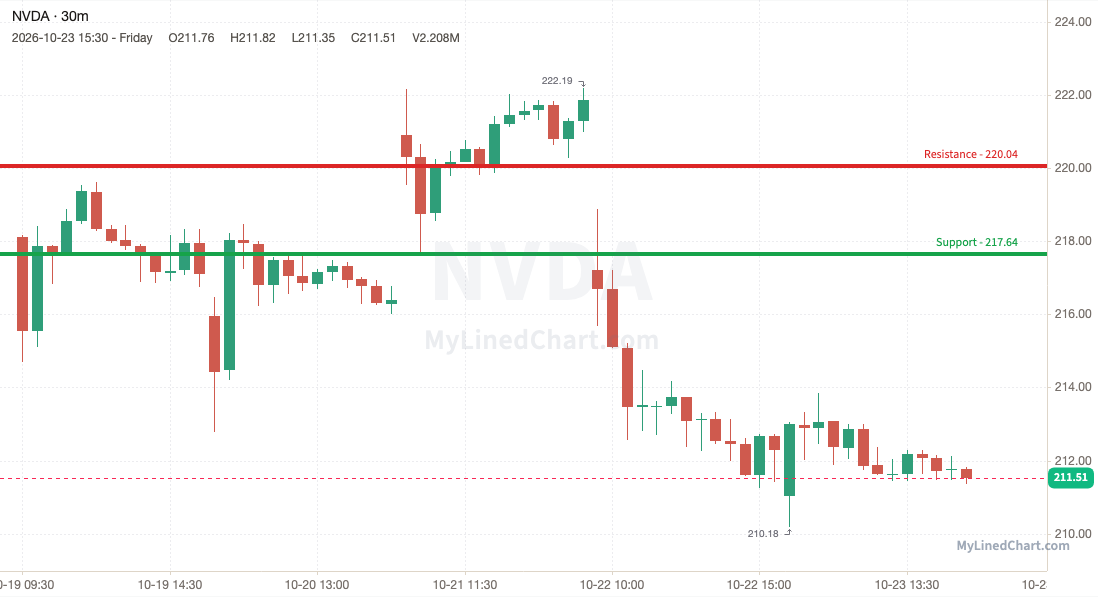
NVDA (NVIDIA) -3.02%
The 217.64 support gave way for NVDA, which closed below it at 211.51, at the bottom of its weekly range.
Busiest levels this week:
NVDA 216.94: most volume, 14596440 shares, touched 29 times
NVDA 214.10: 2nd most, 8124760 shares, touched 17 times
NVDA 214.27: 3rd most, 7564073 shares, touched 12 times
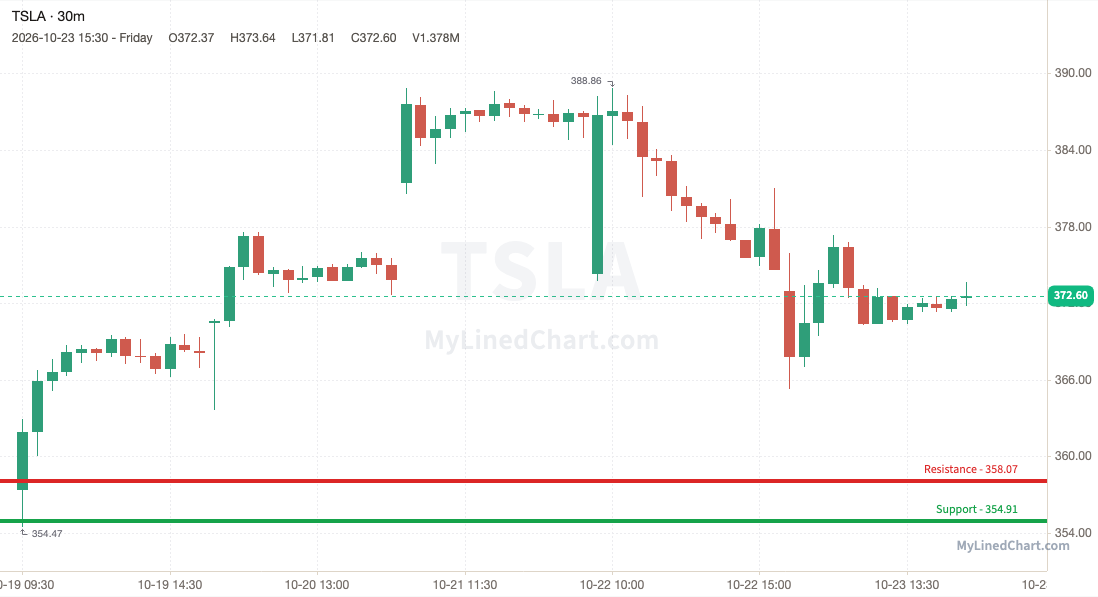
TSLA (Tesla) +4.26%
Buyers had to work for it: TSLA flushed to 354.47, below the 354.91 support, then reclaimed the level and closed at 372.60, mid-range for the week.
Busiest levels this week:
TSLA 374.21: most volume, 3572927 shares, touched 12 times
TSLA 367.69: 2nd most, 1972573 shares, touched 13 times
TSLA 385.58: 3rd most, 1898384 shares, touched 3 times
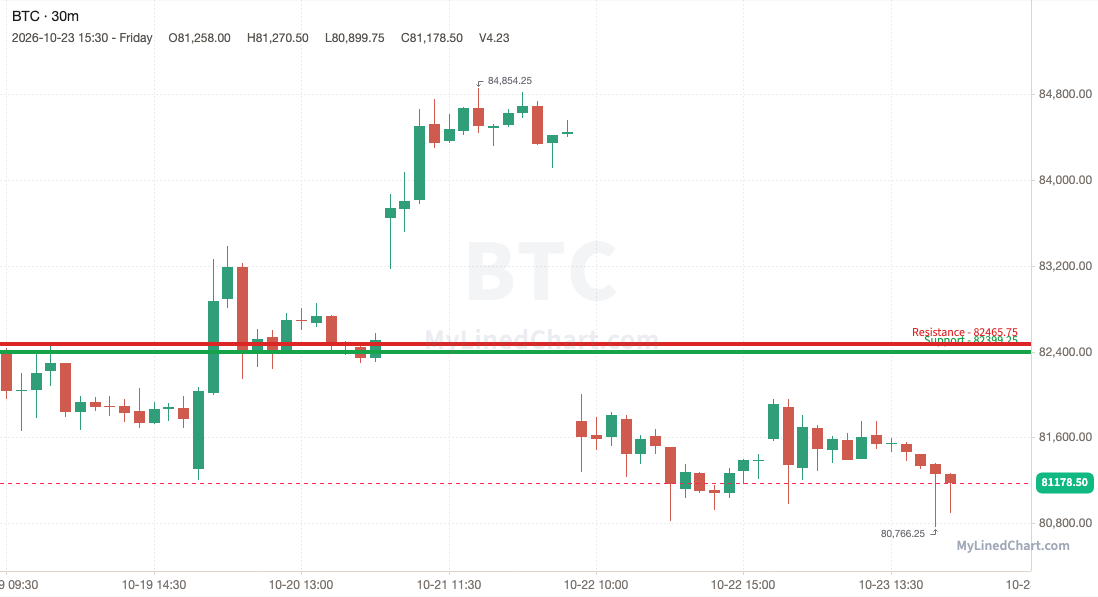
BTC (Bitcoin) -1.49%
BTC lost 82399.25 and stayed under it, ending the week at 81178.50, down at the lows.
Busiest levels this week:
BTC 81564.50: most volume, 7 BTC, touched 11 times
BTC 81641: 2nd most, 6 BTC, touched 17 times
BTC 81509.50: 3rd most, 5 BTC, touched 18 times
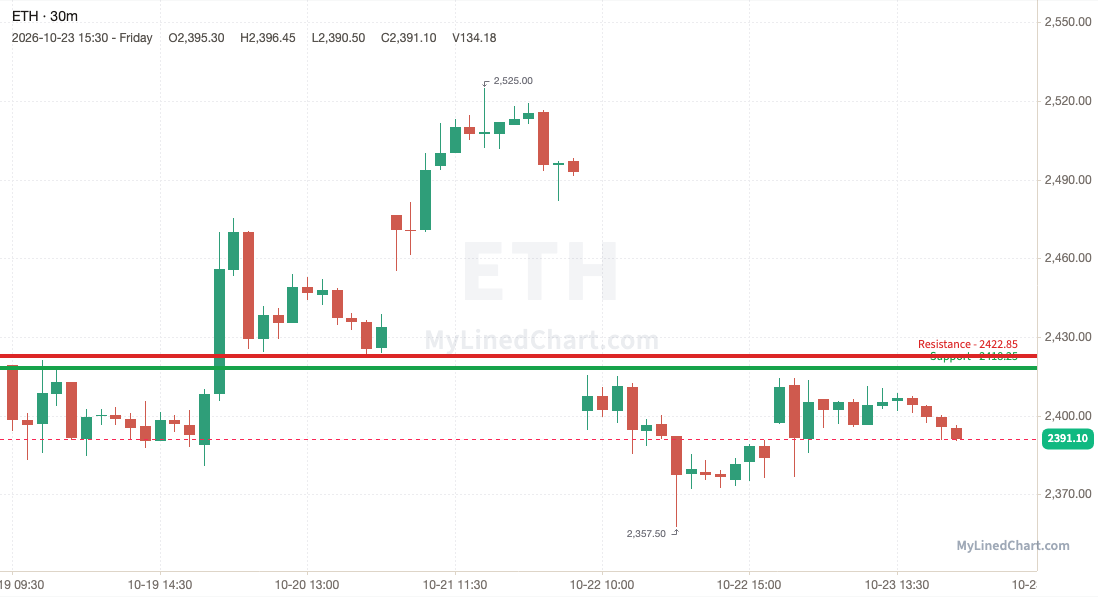
ETH (Ethereum) -1.17%
The 2418.25 support gave way for ETH, which closed below it at 2391.10, around the middle of its weekly range.
Busiest levels this week:
ETH 2437.25: most volume, 856 ETH, touched 4 times
ETH 2430.40: 2nd most, 750 ETH, touched 6 times
ETH 2438.55: 3rd most, 734 ETH, touched 10 times
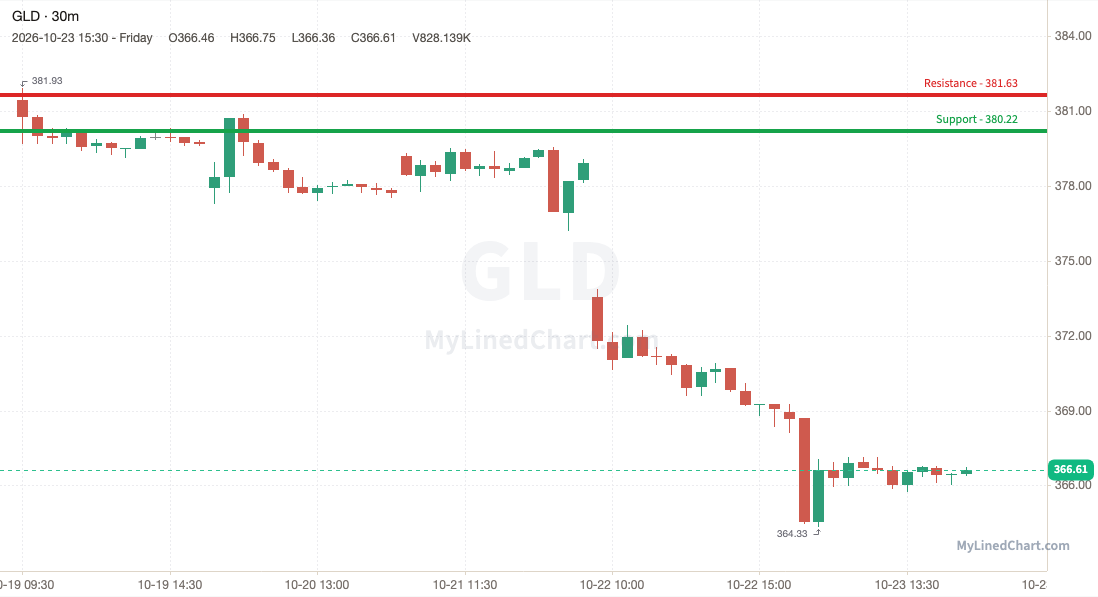
GLD (SPDR Gold Shares) -3.89%
GLD broke the 380.22 support and couldn't get back above it, closing at 366.61, near the week's low.
Busiest levels this week:
GLD 368.96: most volume, 901016 shares, touched 20 times
GLD 379.25: 2nd most, 644615 shares, touched 6 times
GLD 368.77: 3rd most, 560618 shares, touched 11 times
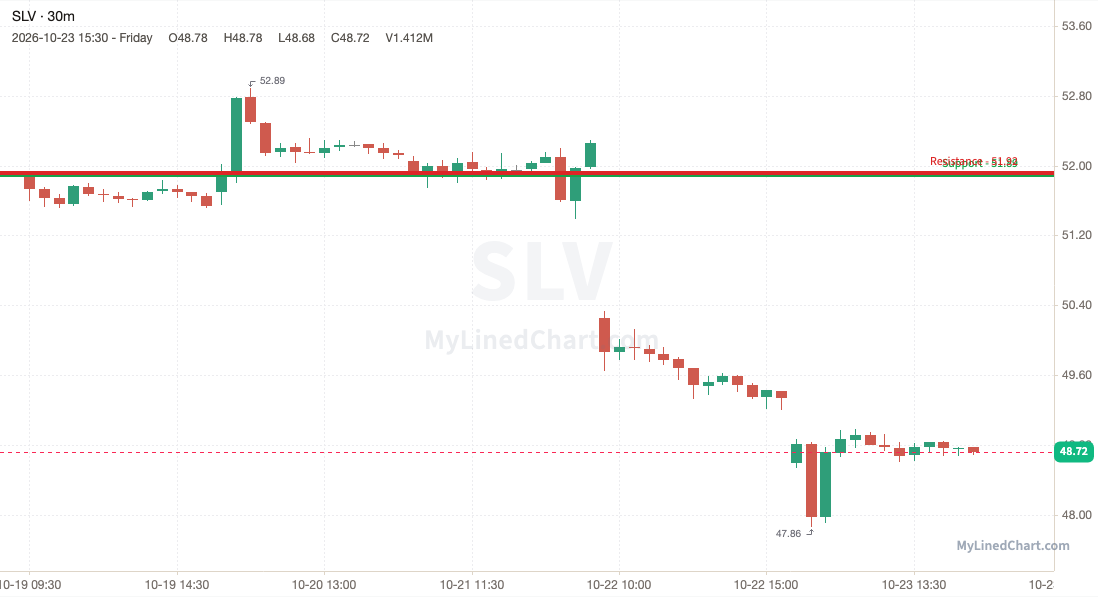
SLV (iShares Silver Trust) -6.15%
SLV lost 51.89 and stayed under it, ending the week at 48.72, down at the lows.
Busiest levels this week:
SLV 51.37: most volume, 6321087 shares, touched 37 times
SLV 52.54: 2nd most, 6046872 shares, touched 49 times
SLV 52.35: 3rd most, 5710516 shares, touched 47 times
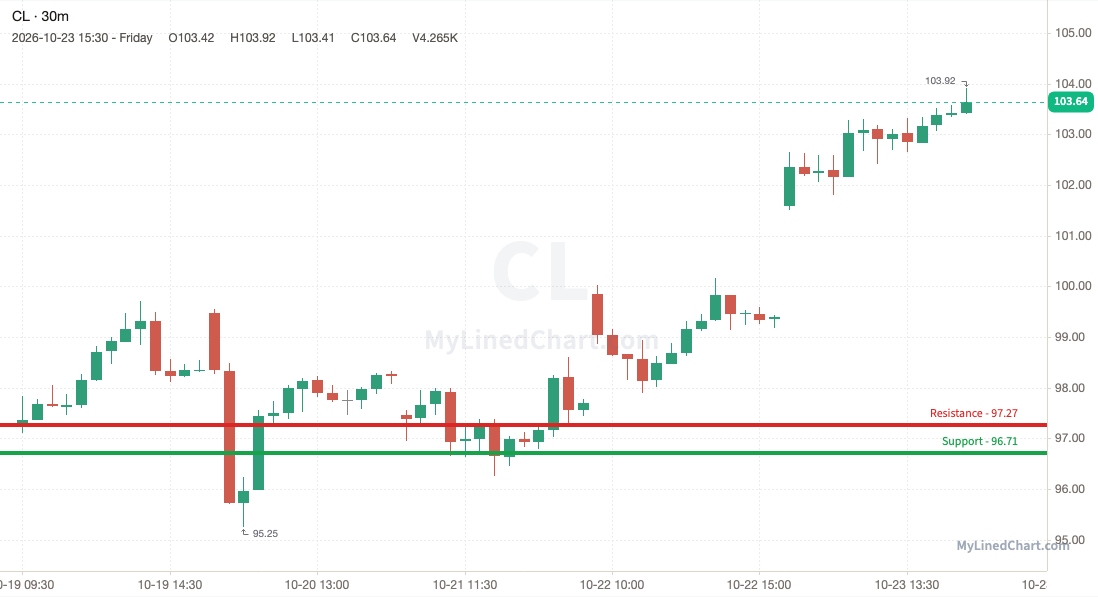
CL (Crude Oil futures) +6.59%
CL lost 96.71 intraday on a dip to 95.25, but clawed it all back to finish at 103.64, at the top of its weekly range.
Busiest levels this week:
CL 97.74: most volume, 13552 contracts, touched 12 times
CL 97.94: 2nd most, 11215 contracts, touched 14 times
CL 98.97: 3rd most, 9477 contracts, touched 6 times
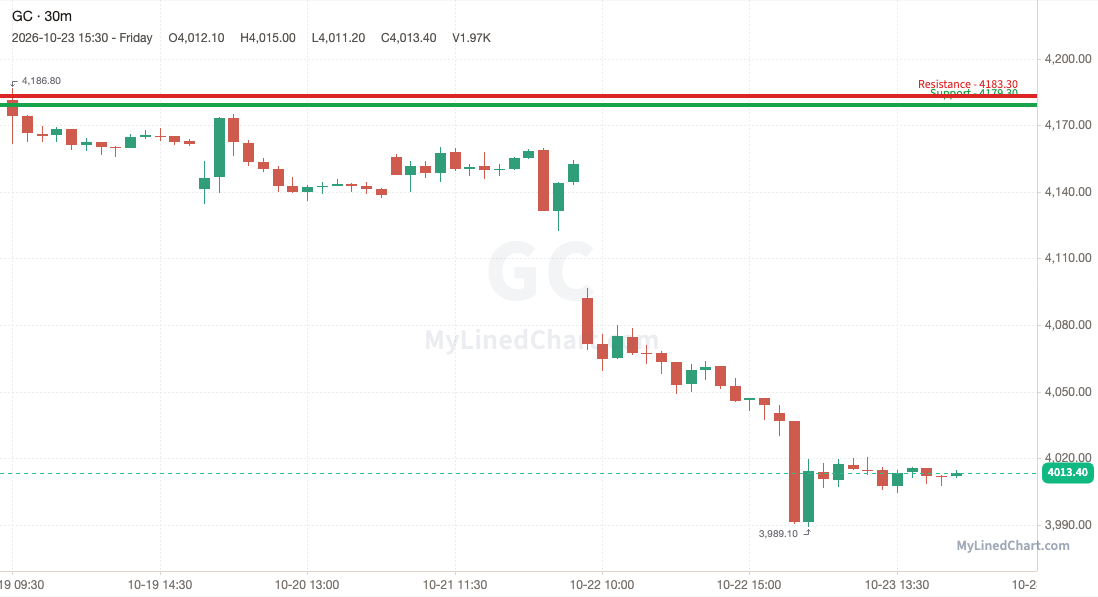
GC (Gold futures) -4.01%
GC broke the 4179.30 support and couldn't get back above it, closing at 4013.40, near the week's low.
Busiest levels this week:
GC 4183.30: most volume, 12086 contracts, touched 33 times
GC 4179.30: 2nd most, 8602 contracts, touched 22 times
GC 4160.30: 3rd most, 8031 contracts, touched 31 times
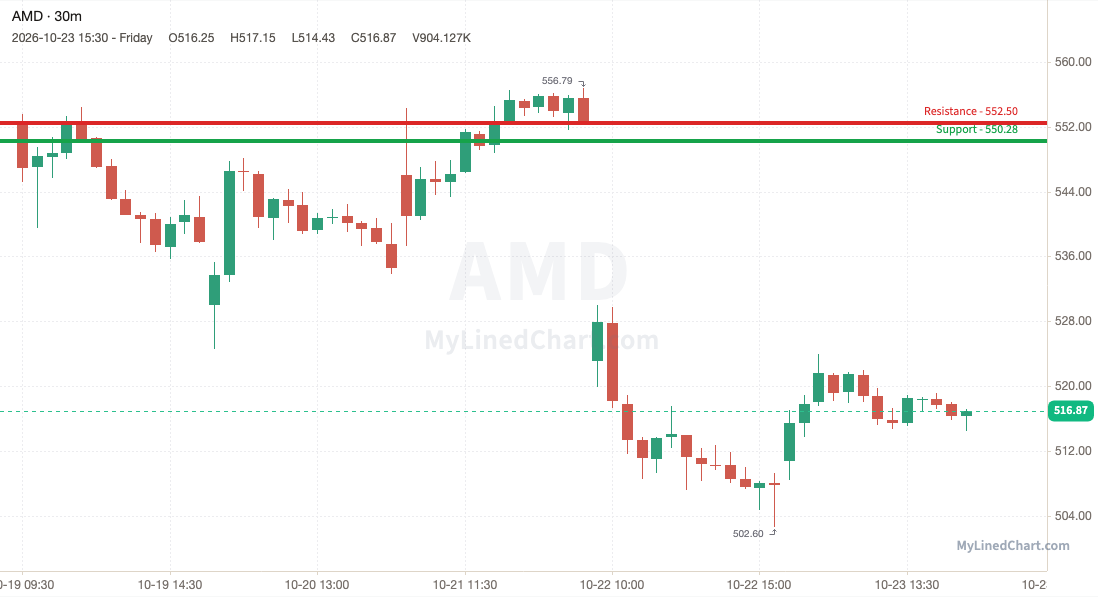
AMD (Advanced Micro Devices) -6.41%
AMD lost 550.28 and stayed under it, ending the week at 516.87, in the middle of its range.
Busiest levels this week:
AMD 507.83: most volume, 776993 shares, touched 5 times
AMD 507.58: 2nd most, 726377 shares, touched 4 times
AMD 534.50: 3rd most, 497258 shares, touched 4 times
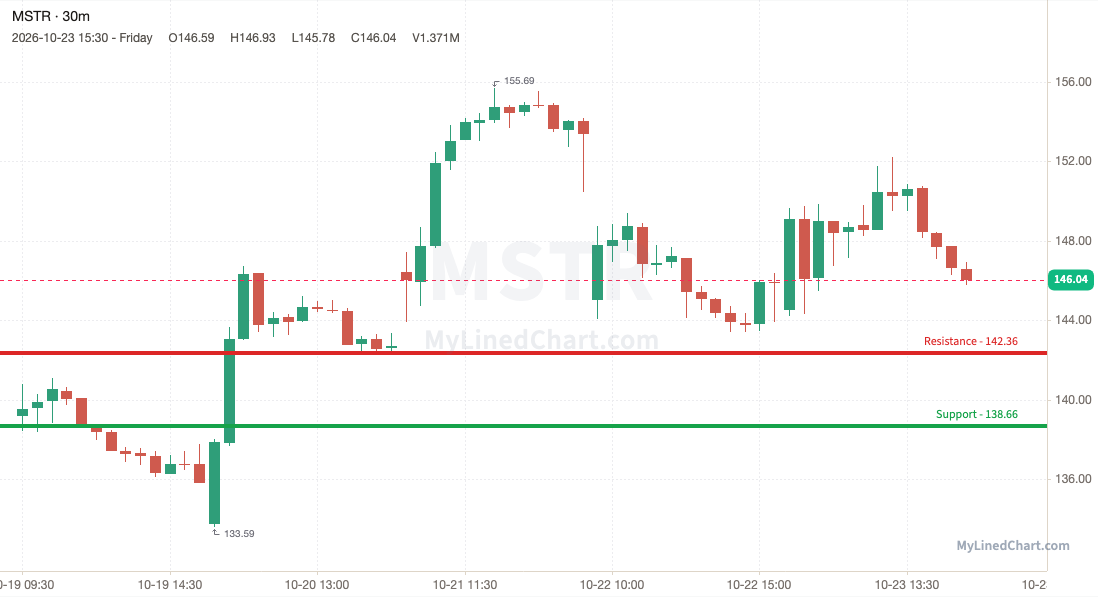
MSTR (Strategy) +4.91%
Buyers had to work for it: MSTR flushed to 133.59, below the 138.66 support, then reclaimed the level and closed at 146.04, around the middle of its weekly range.
Busiest levels this week:
MSTR 136.75: most volume, 945951 shares, touched 5 times
MSTR 153.32: 2nd most, 910572 shares, touched 14 times
MSTR 142.80: 3rd most, 817409 shares, touched 5 times
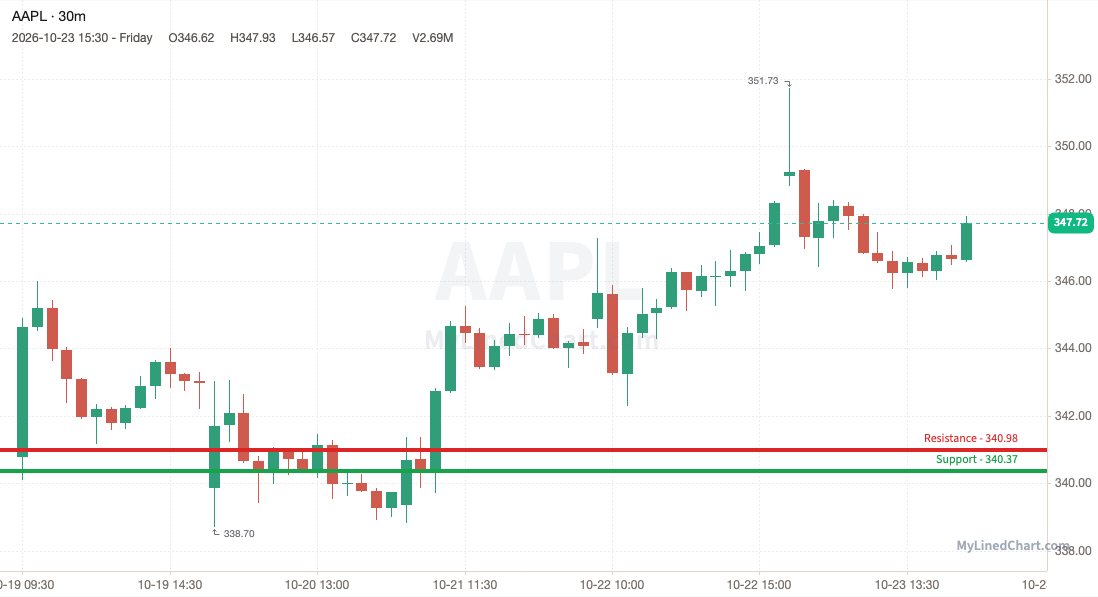
AAPL (Apple) +2.04%
AAPL lost 340.37 intraday on a dip to 338.74, but clawed it all back to finish at 347.72, mid-range for the week.
Busiest levels this week:
AAPL 339.90: most volume, 1851821 shares, touched 3 times
AAPL 343.04: 2nd most, 1765289 shares, touched 13 times
AAPL 342.87: 3rd most, 1559227 shares, touched 5 times
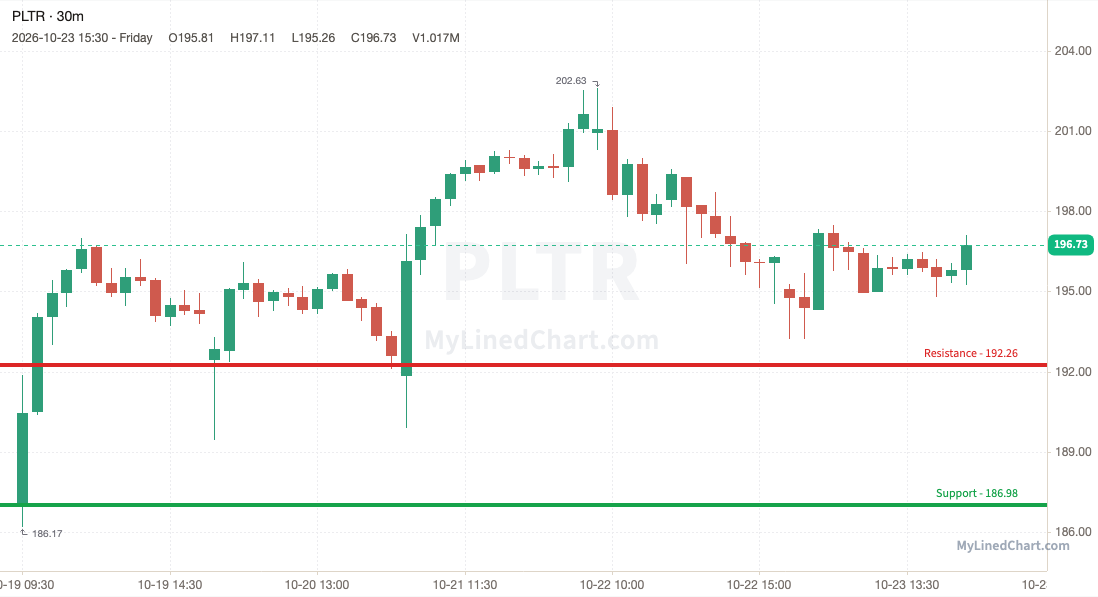
PLTR (Palantir) +5.21%
A midweek shakeout dragged PLTR down to 186.17 beneath 186.98 before it recovered the line and settled at 196.73, in the middle of its range.
Busiest levels this week:
PLTR 192.57: most volume, 1203773 shares, touched 13 times
PLTR 192.26: 2nd most, 1183697 shares, touched 4 times
PLTR 192.75: 3rd most, 1117196 shares, touched 14 times
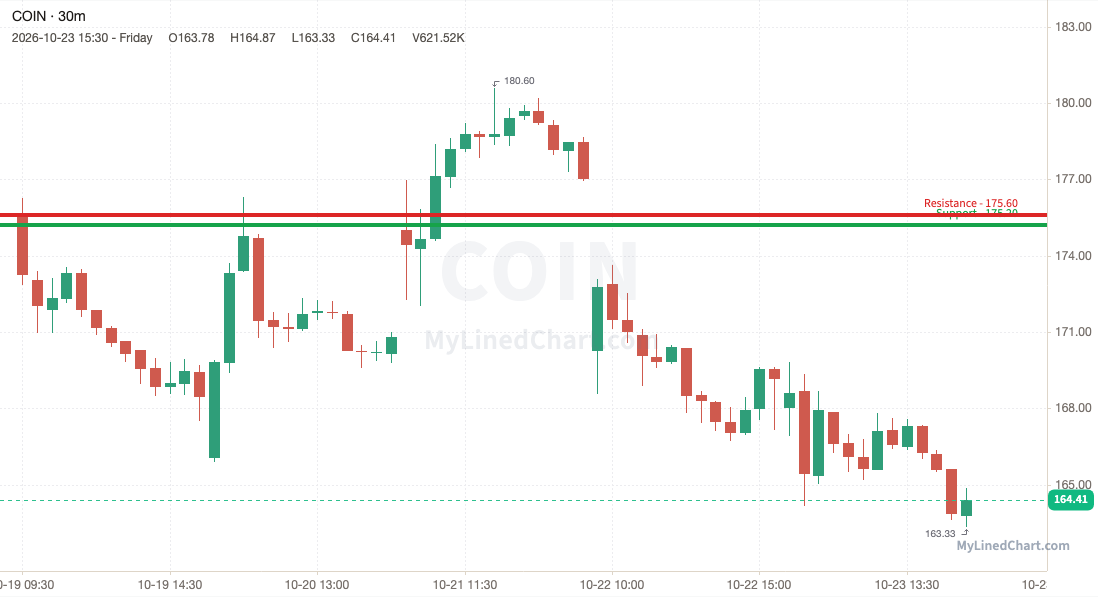
COIN (Coinbase) -6.36%
The 175.20 support gave way for COIN, which closed below it at 164.41, at the bottom of its weekly range.
Busiest levels this week:
COIN 169.31: most volume, 515362 shares, touched 4 times
COIN 168.99: 2nd most, 456884 shares, touched 8 times
COIN 168.06: 3rd most, 325912 shares, touched 7 times
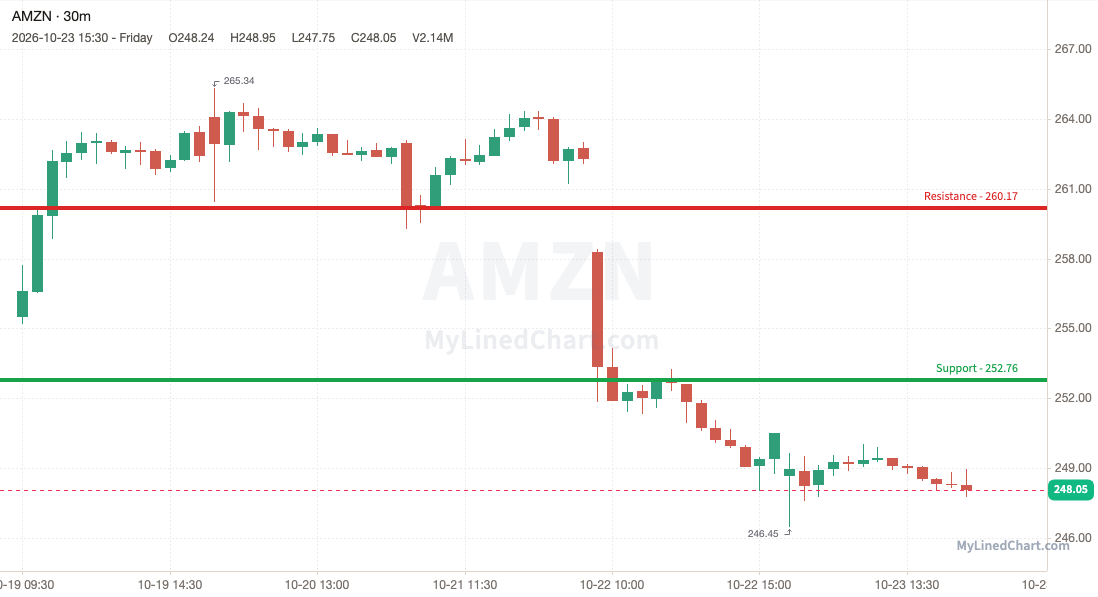
AMZN (Amazon) -2.91%
AMZN broke the 252.76 support and couldn't get back above it, closing at 248.05, near the week's low.
Busiest levels this week:
AMZN 262.35: most volume, 4902742 shares, touched 21 times
AMZN 249.85: 2nd most, 2310247 shares, touched 12 times
AMZN 250.17: 3rd most, 2162162 shares, touched 19 times
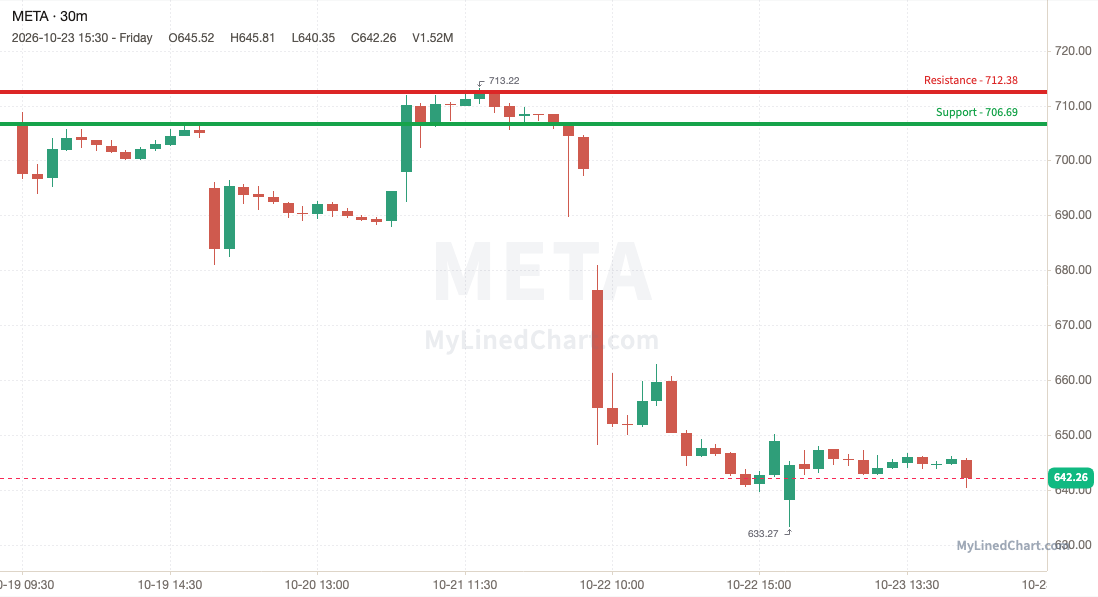
META (Meta Platforms) -9.13%
META lost 706.69 and stayed under it, ending the week at 642.26, down at the lows.
Busiest levels this week:
META 648.51: most volume, 327432 shares, touched 5 times
META 648.65: 2nd most, 321636 shares, touched 3 times
META 718.93: 3rd most, 283192 shares, touched 6 times
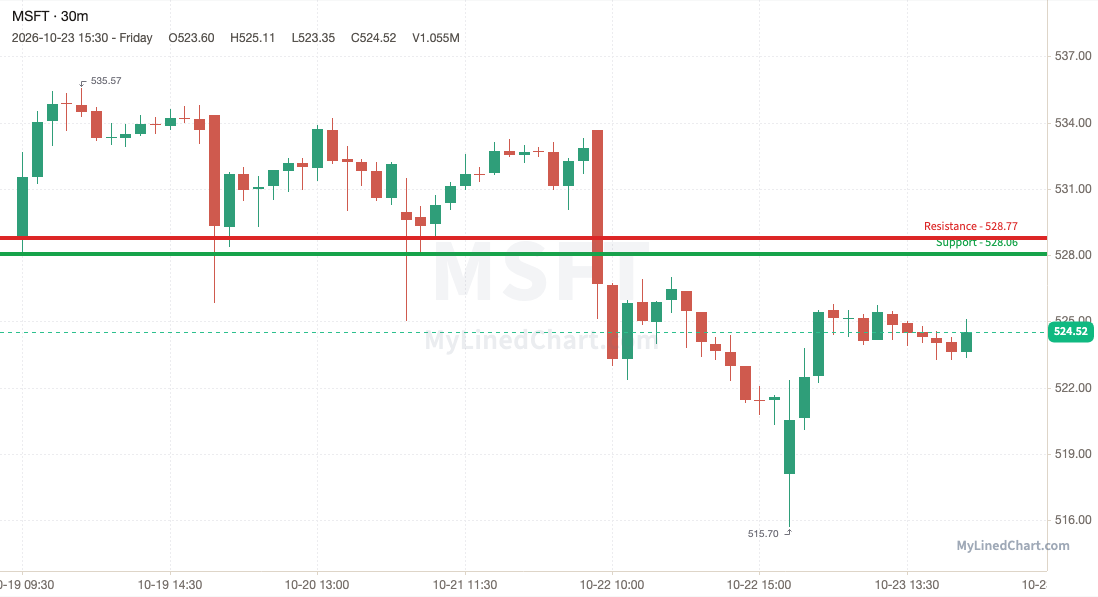
MSFT (Microsoft) -0.79%
The 528.06 support gave way for MSFT, which closed below it at 524.52, around the middle of its weekly range.
Busiest levels this week:
MSFT 533.12: most volume, 442537 shares, touched 5 times
MSFT 534.23: 2nd most, 417045 shares, touched 7 times
MSFT 518.22: 3rd most, 397158 shares, touched 7 times
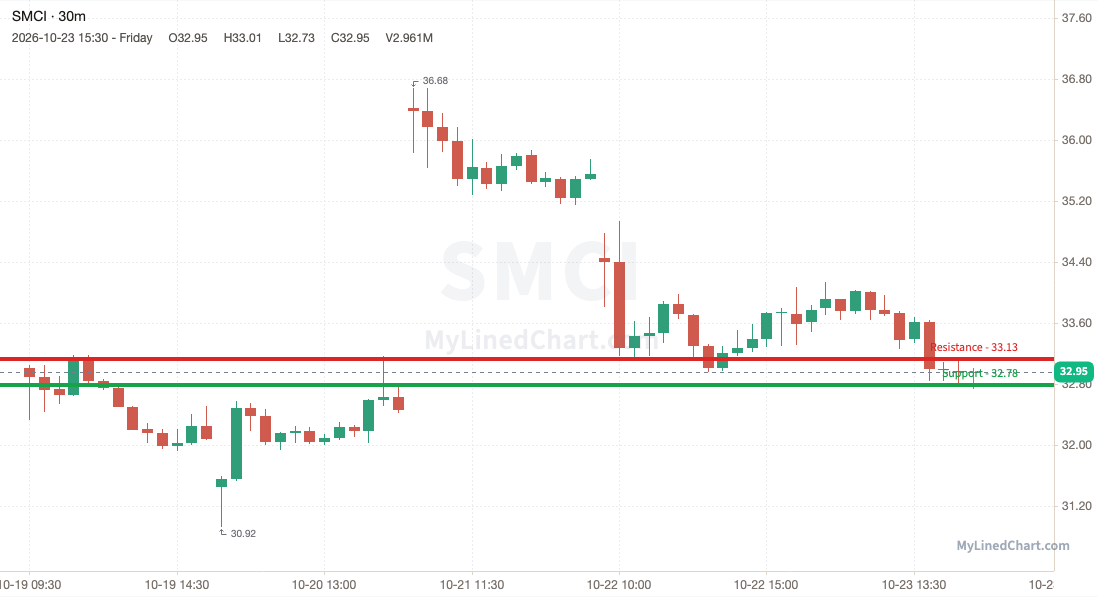
SMCI (Super Micro Computer) -0.15%
SMCI dipped under 32.78 to 30.92, then bought back up to close the week at 32.95, mid-range for the week.
Busiest levels this week:
SMCI 32.36: most volume, 12852477 shares, touched 51 times
SMCI 32.13: 2nd most, 3434722 shares, touched 16 times
SMCI 32.78: 3rd most, 2934241 shares, touched 8 times
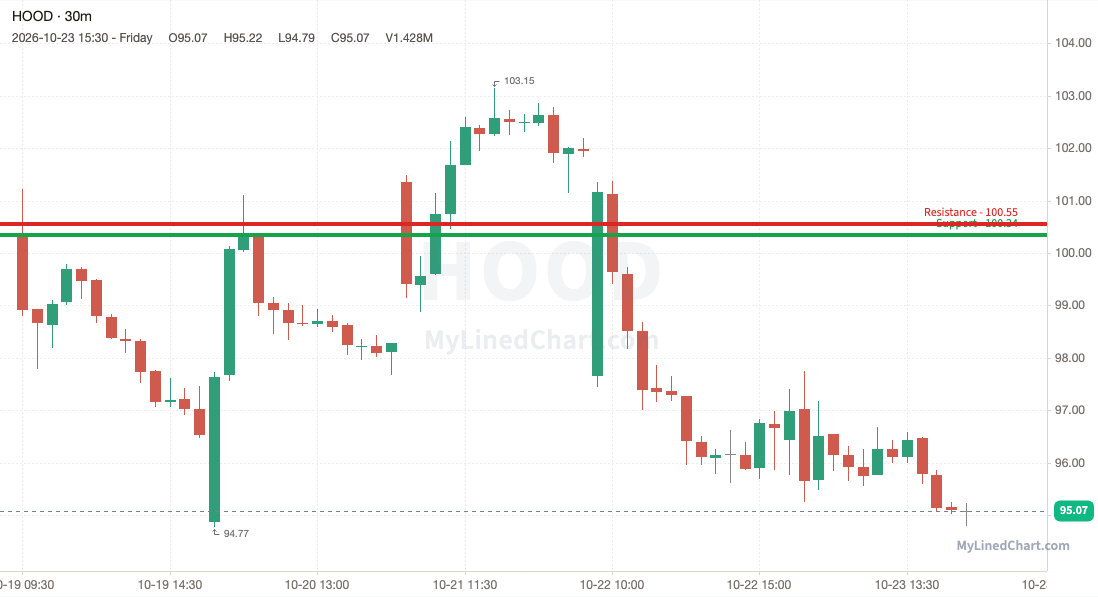
HOOD (Robinhood) -5.29%
HOOD lost 100.34 and stayed under it, ending the week at 95.07, down at the lows.
Busiest levels this week:
HOOD 96.59: most volume, 2161653 shares, touched 30 times
HOOD 96.77: 2nd most, 2053779 shares, touched 21 times
HOOD 96.70: 3rd most, 1973010 shares, touched 7 times
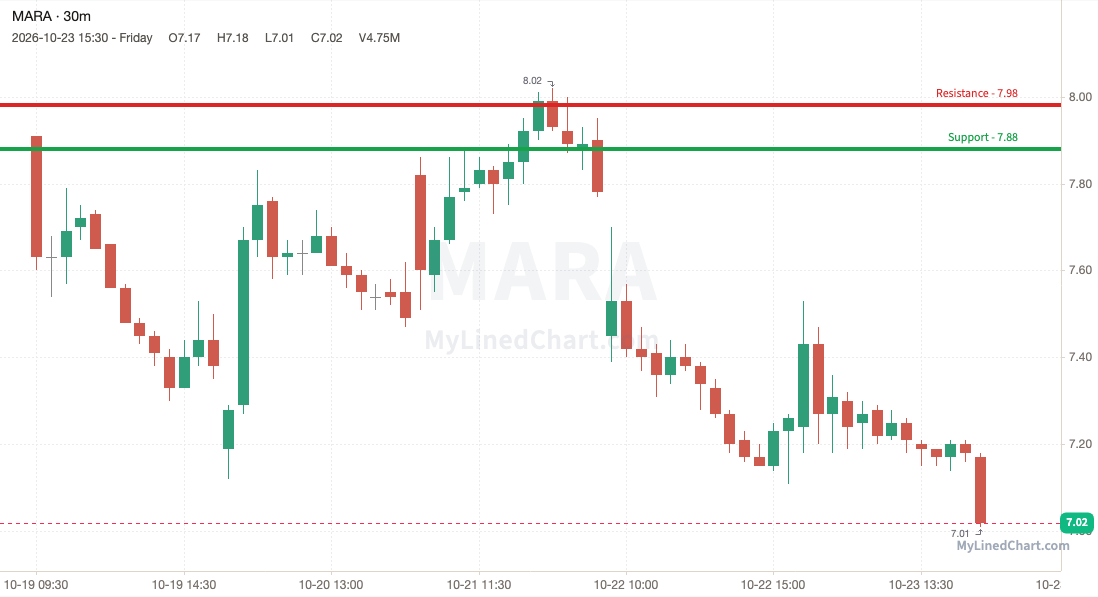
MARA (MARA Holdings) -11.25%
The 7.88 support gave way for MARA, which closed below it at 7.02, at the bottom of its weekly range.
Busiest levels this week:
MARA 7.66: most volume, 12273376 shares, touched 26 times
MARA 7.83: 2nd most, 10721091 shares, touched 24 times
MARA 8.21: 3rd most, 10432221 shares, touched 13 times
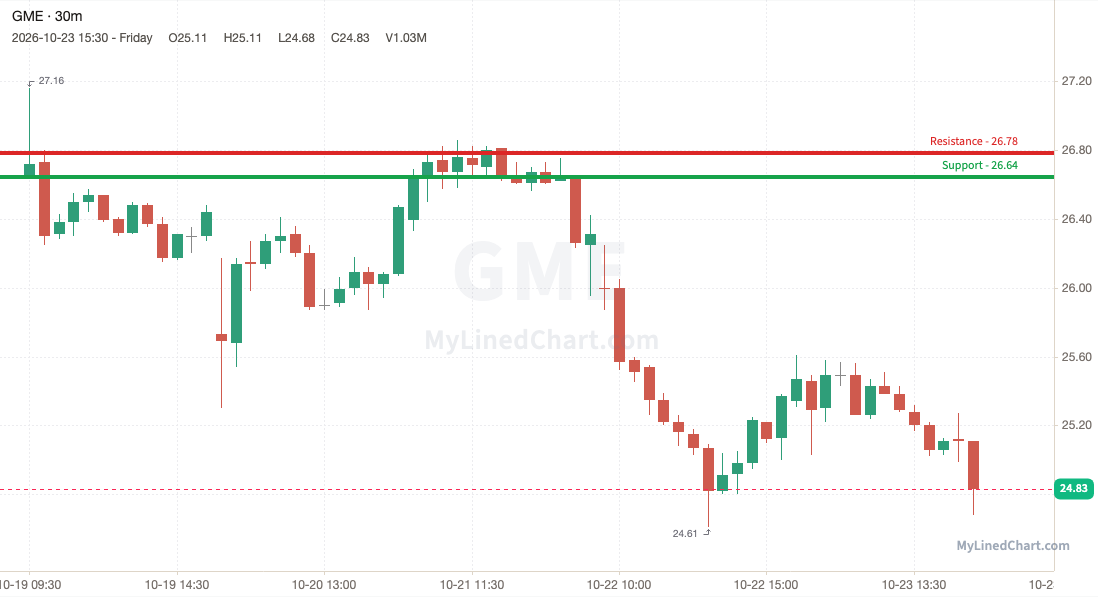
GME (GameStop) -6.83%
GME broke the 26.64 support and couldn't get back above it, closing at 24.83, near the week's low.
Busiest levels this week:
GME 26.96: most volume, 2227361 shares, touched 20 times
GME 26.64: 2nd most, 1944954 shares, touched 7 times
GME 27.27: 3rd most, 1581521 shares, touched 22 times
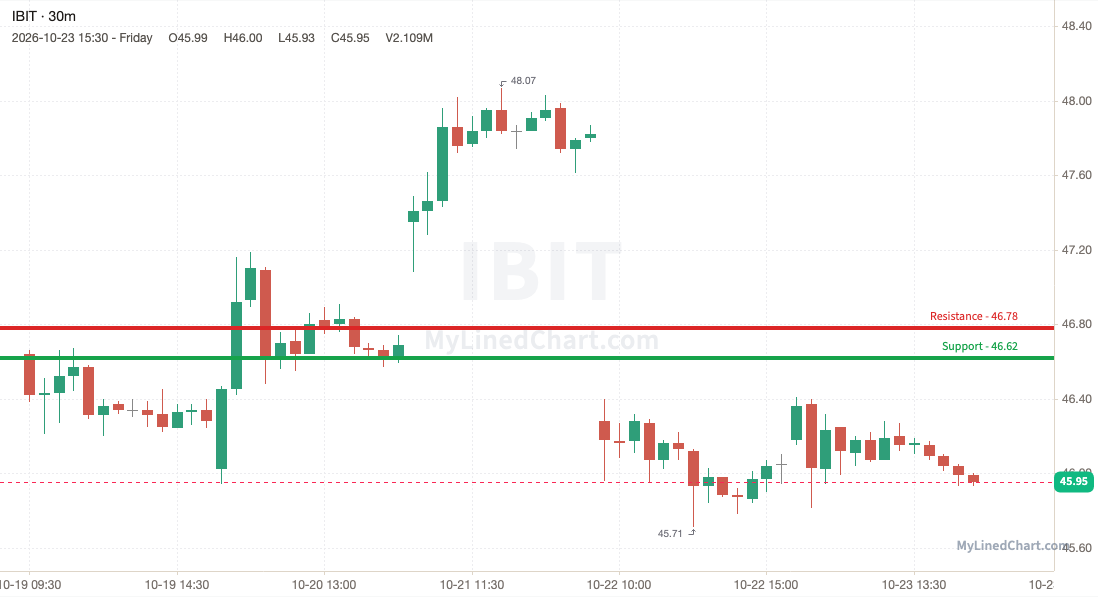
IBIT (iShares Bitcoin Trust) -1.48%
IBIT lost 46.62 and stayed under it, ending the week at 45.95, down at the lows.
Busiest levels this week:
IBIT 47.03: most volume, 13377645 shares, touched 44 times
IBIT 46.30: 2nd most, 9857021 shares, touched 32 times
IBIT 46.08: 3rd most, 8476428 shares, touched 19 times
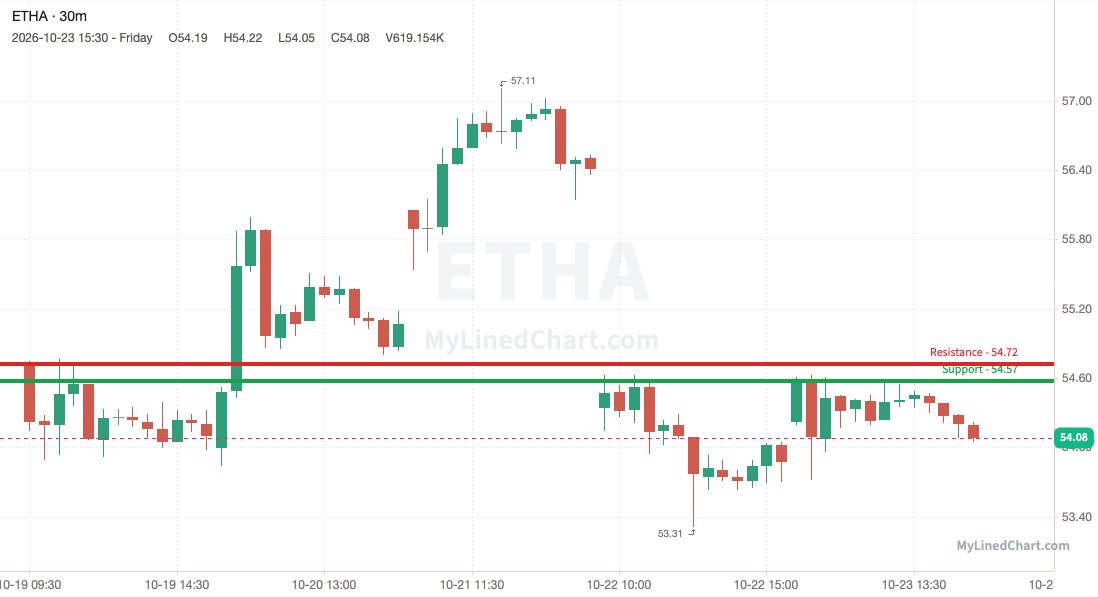
ETHA (iShares Ethereum Trust) -1.15%
The 54.57 support gave way for ETHA, which closed below it at 54.08, around the middle of its weekly range.
Busiest levels this week:
ETHA 54.12: most volume, 4501006 shares, touched 58 times
ETHA 56.27: 2nd most, 4464481 shares, touched 47 times
ETHA 56.69: 3rd most, 3088322 shares, touched 24 times
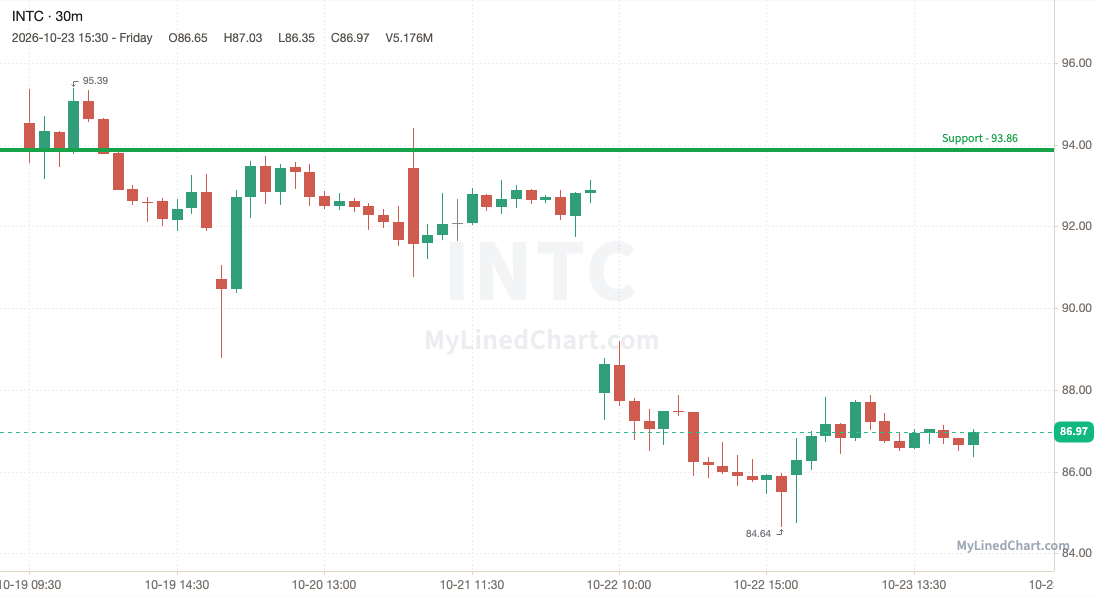
INTC (Intel) -8.00%
INTC broke the 93.86 support and couldn't get back above it, closing at 86.97, mid-range for the week.
Busiest levels this week:
INTC 92.92: most volume, 18710842 shares, touched 29 times
INTC 92.72: 2nd most, 7429351 shares, touched 23 times
INTC 92.55: 3rd most, 7102728 shares, touched 16 times
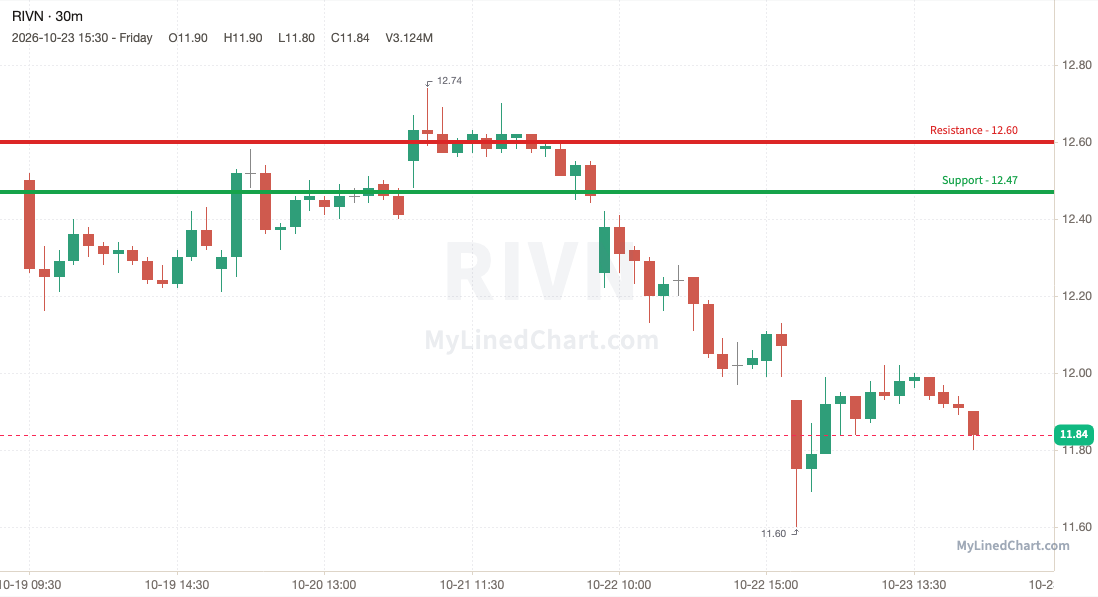
RIVN (Rivian) -5.28%
RIVN lost 12.47 and stayed under it, ending the week at 11.84, in the middle of its range.
Busiest levels this week:
RIVN 12.46: most volume, 7839513 shares, touched 25 times
RIVN 12.60: 2nd most, 7001143 shares, touched 21 times
RIVN 12.24: 3rd most, 5785293 shares, touched 22 times
See the Active Traders trade plan
Touches show how often traders defended a price; each test can wear it down. Volume shows how much trading happened there, and heavy-volume prices tend to pull price back because many traders hold positions there.
Levels for the week ahead
SPY
SPY closed the week at 759.91. For the week ahead the weekly pivot is 764.34, with R1 at 770.01 and S1 at 754.25. Last week's range ran from 758.68 to 774.44.
| Weekly level | Price | From the close |
|---|---|---|
| Last week high | 774.44 | +14.53 |
| Weekly R1 | 770.01 | +10.10 |
| Weekly pivot | 764.34 | +4.43 |
| Last week low | 758.68 | -1.23 |
| Weekly S1 | 754.25 | -5.66 |
ES
ES closed the week at 7672.25. For the week ahead the weekly pivot is 7710.83, with R1 at 7773.17 and S1 at 7609.92. Last week's range ran from 7648.50 to 7811.75.
| Weekly level | Price | From the close |
|---|---|---|
| Last week high | 7811.75 | +139.50 |
| Weekly R1 | 7773.17 | +100.92 |
| Weekly pivot | 7710.83 | +38.58 |
| Last week low | 7648.50 | -23.75 |
| Weekly S1 | 7609.92 | -62.33 |
QQQ
QQQ closed the week at 704.39. For the week ahead the weekly pivot is 711.17, with R1 at 721.17 and S1 at 694.38. Last week's range ran from 701.16 to 727.95.
| Weekly level | Price | From the close |
|---|---|---|
| Last week high | 727.95 | +23.56 |
| Weekly R1 | 721.17 | +16.78 |
| Weekly pivot | 711.17 | +6.78 |
| Last week low | 701.16 | -3.23 |
| Weekly S1 | 694.38 | -10.01 |
NQ
NQ closed the week at 29177. For the week ahead the weekly pivot is 29425.75, with R1 at 29865.25 and S1 at 28737.50. Last week's range ran from 28986.25 to 30114.
| Weekly level | Price | From the close |
|---|---|---|
| Last week high | 30114 | +937 |
| Weekly R1 | 29865.25 | +688.25 |
| Weekly pivot | 29425.75 | +248.75 |
| Last week low | 28986.25 | -190.75 |
| Weekly S1 | 28737.50 | -439.50 |
US market calendar for the week of October 26 to 30
The US calendar for the week of October 26 to 30: 3 scheduled events, all times ET.
Wednesday, October 28
- 2:00 PM ET: FOMC rate decision (meeting Oct 27-28)
Thursday, October 29
- 8:30 AM ET: GDP, Q3 advance estimate (BEA)
- 8:30 AM ET: Personal Income and Outlays, PCE for September (BEA)
See the latest daily SPY, ES, QQQ & NQ levels, posted the evening before the next day's session.
MyLinedChart turns your technical analysis into trading rules. Draw your levels, export your entire chart to XLSX, and turn your rules into trades. Or, have Claude, Codex, or Cursor do the work for you.
Not financial advice. Objective market structure and levels only. You make and own your trades.