
SPY, ES Day Trade Levels: Nov 2-6 Week in Review and Chart Pack
Published · Lee H.
A red week: all 4 finished lower, with the week's low on Thursday, November 5.
How each one played out
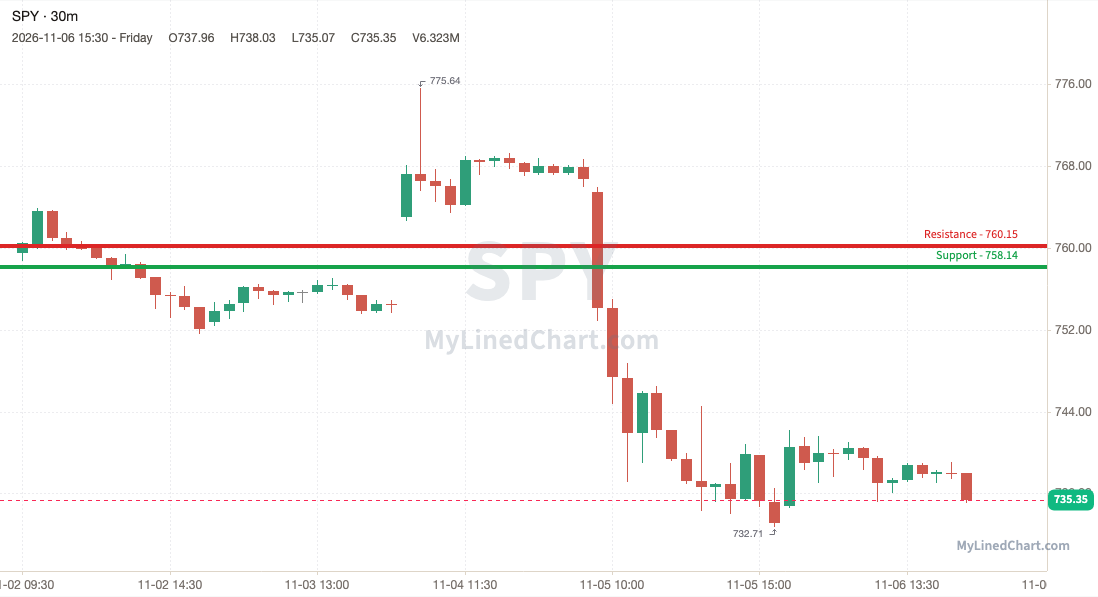
SPY (S&P 500 ETF) -3.17%
The 758.14 support gave way for SPY, which closed below it at 735.35, at the bottom of its weekly range.
Busiest levels this week:
SPY 750.47: most volume, 22683635 shares, touched 81 times
SPY 768.06: 2nd most, 4937164 shares, touched 18 times
SPY 755.50: 3rd most, 3244450 shares, touched 7 times
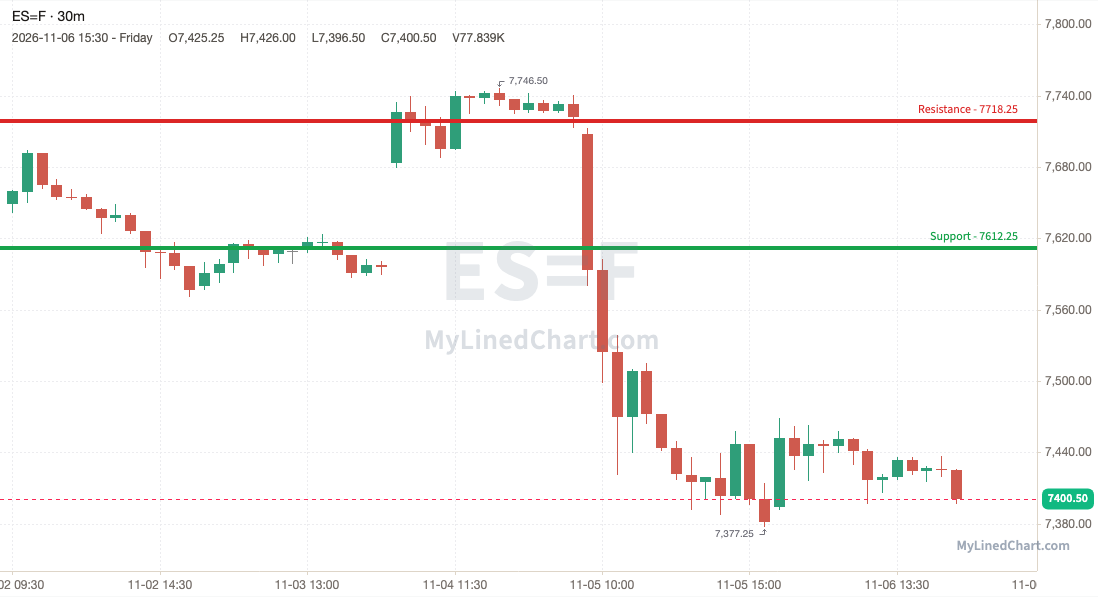
ES (E-mini S&P 500 futures) -3.18%
ES broke the 7612.25 support and couldn't get back above it, closing at 7405.75, near the week's low.
Busiest levels this week:
ES 7733.25: most volume, 72388 contracts, touched 15 times
ES 7741: 2nd most, 57359 contracts, touched 10 times
ES 7726.25: 3rd most, 44441 contracts, touched 10 times
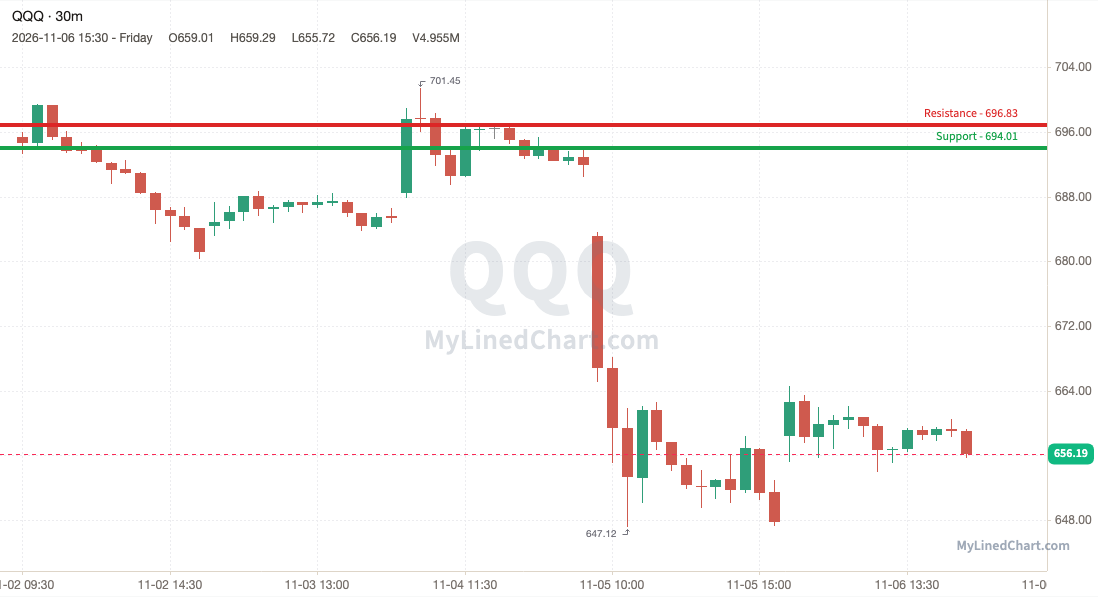
QQQ (Nasdaq 100 ETF) -5.63%
QQQ lost 694.01 and stayed under it, ending the week at 656.19, down at the lows.
Busiest levels this week:
QQQ 681.84: most volume, 11004627 shares, touched 25 times
QQQ 679.45: 2nd most, 6275829 shares, touched 22 times
QQQ 693.44: 3rd most, 5528478 shares, touched 20 times
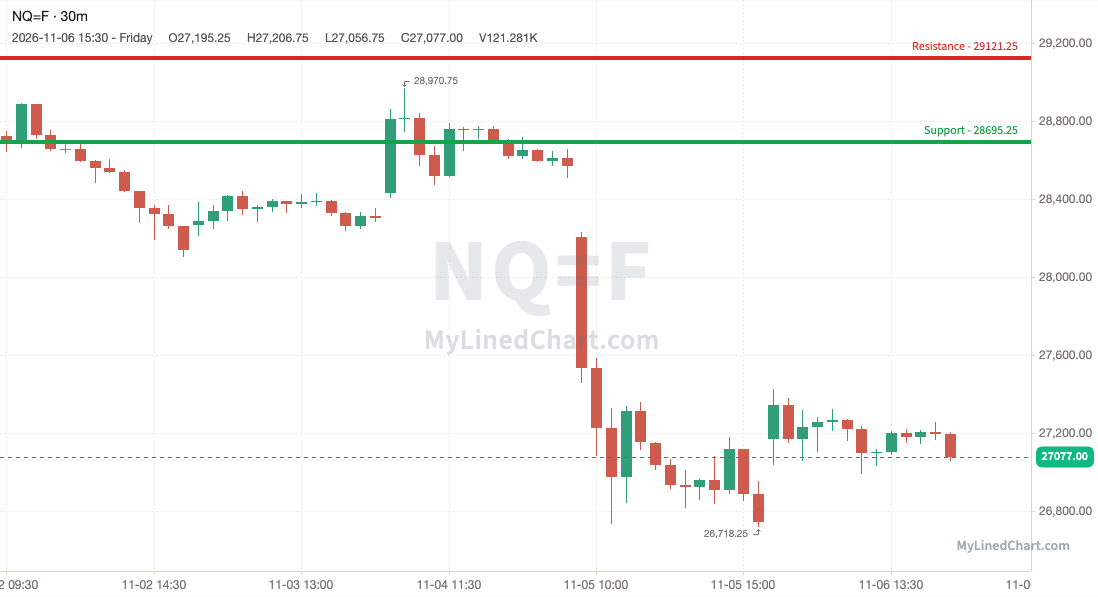
NQ (E-mini Nasdaq 100 futures) -5.62%
The 28695.25 support gave way for NQ, which closed below it at 27107.50, around the middle of its weekly range.
Busiest levels this week:
NQ 28695.25: most volume, 29190 contracts, touched 3 times
NQ 28647.25: 2nd most, 25475 contracts, touched 3 times
NQ 28669.25: 3rd most, 25443 contracts, touched 3 times
Active Traders
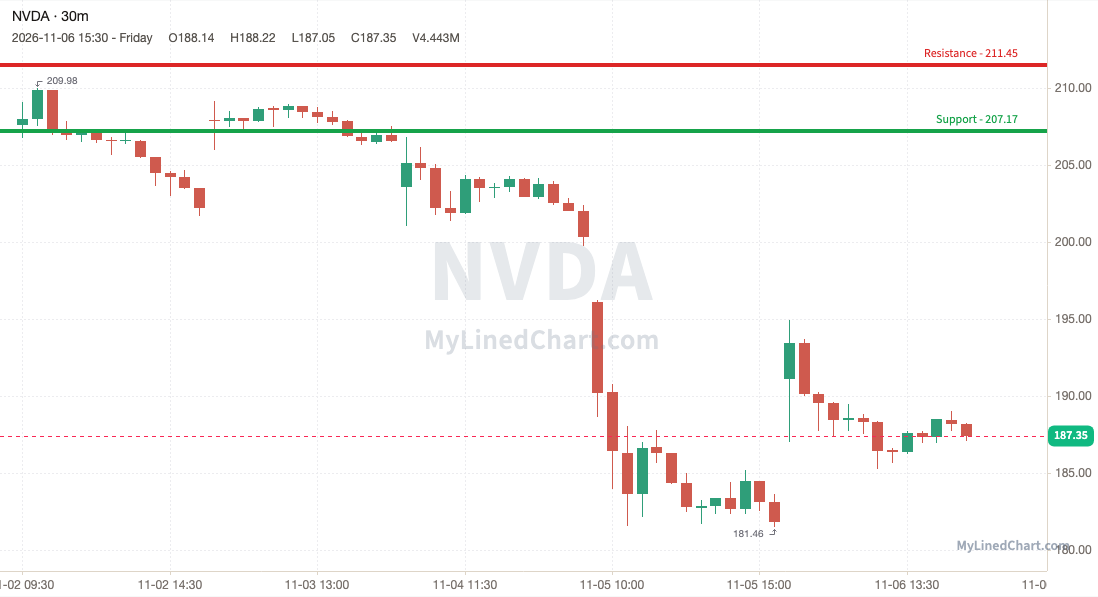
NVDA (NVIDIA) -9.74%
NVDA broke the 207.17 support and couldn't get back above it, closing at 187.35, mid-range for the week.
Busiest levels this week:
NVDA 204.83: most volume, 10926154 shares, touched 19 times
NVDA 204.67: 2nd most, 9415544 shares, touched 26 times
NVDA 204.46: 3rd most, 8685388 shares, touched 21 times
TSLA (Tesla) -11.11%
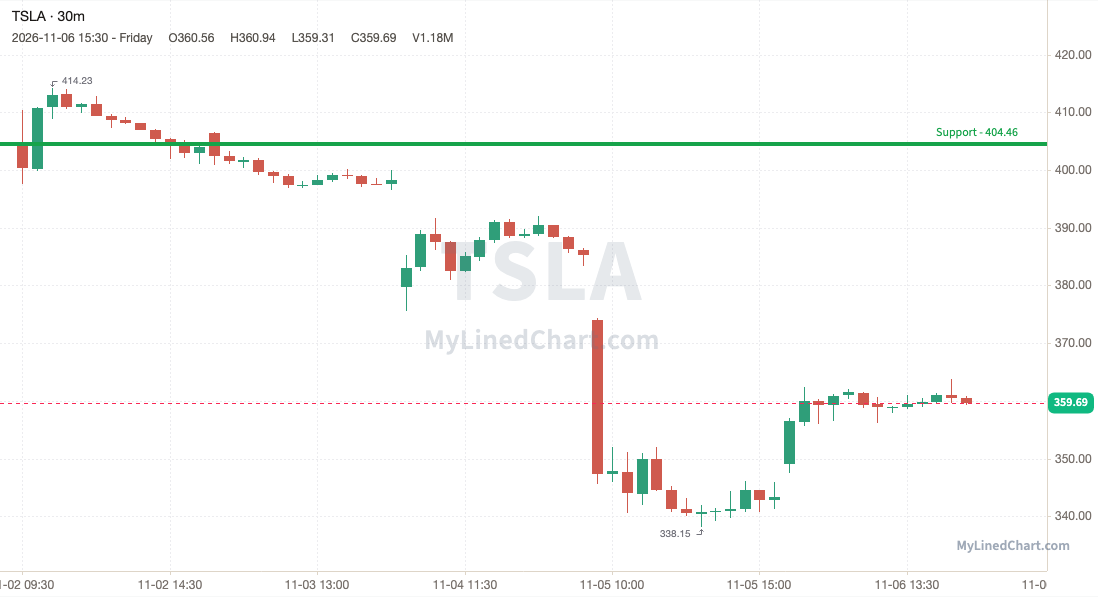
TSLA lost 404.46 and stayed under it, ending the week at 359.69, in the middle of its range.
Busiest levels this week:
TSLA 398.34: most volume, 2471938 shares, touched 12 times
TSLA 398.16: 2nd most, 2437117 shares, touched 9 times
TSLA 402.80: 3rd most, 2403020 shares, touched 3 times
BTC (Bitcoin) -2.44%
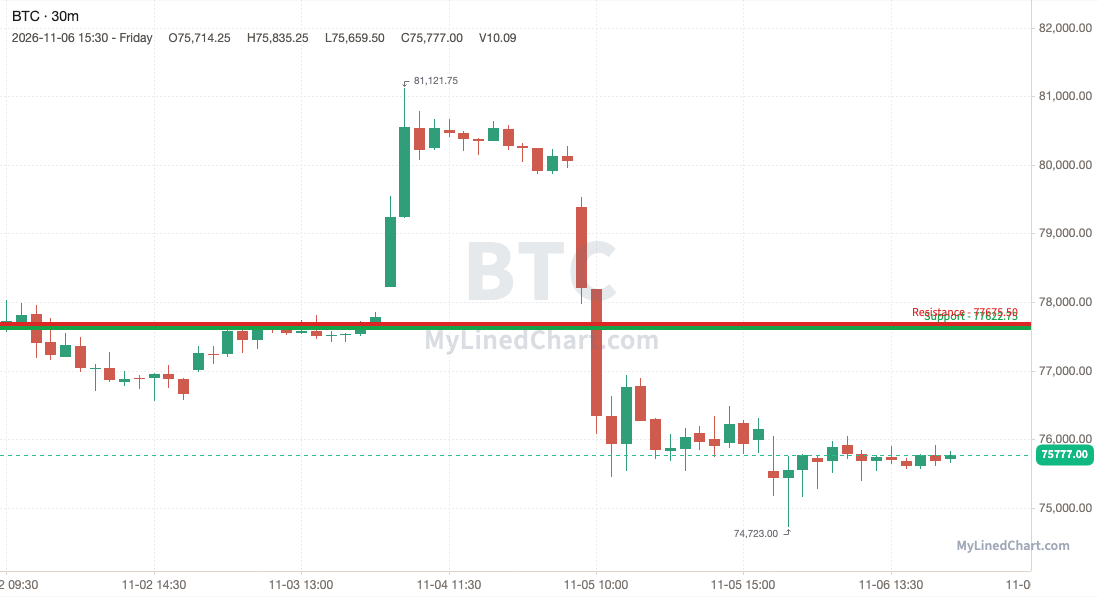
The 77622.75 support gave way for BTC, which closed below it at 75777, at the bottom of its weekly range.
Busiest levels this week:
BTC 76747: most volume, 28 BTC, touched 18 times
BTC 76818.75: 2nd most, 27 BTC, touched 26 times
BTC 76884.50: 3rd most, 27 BTC, touched 32 times
ETH (Ethereum) -2.44%
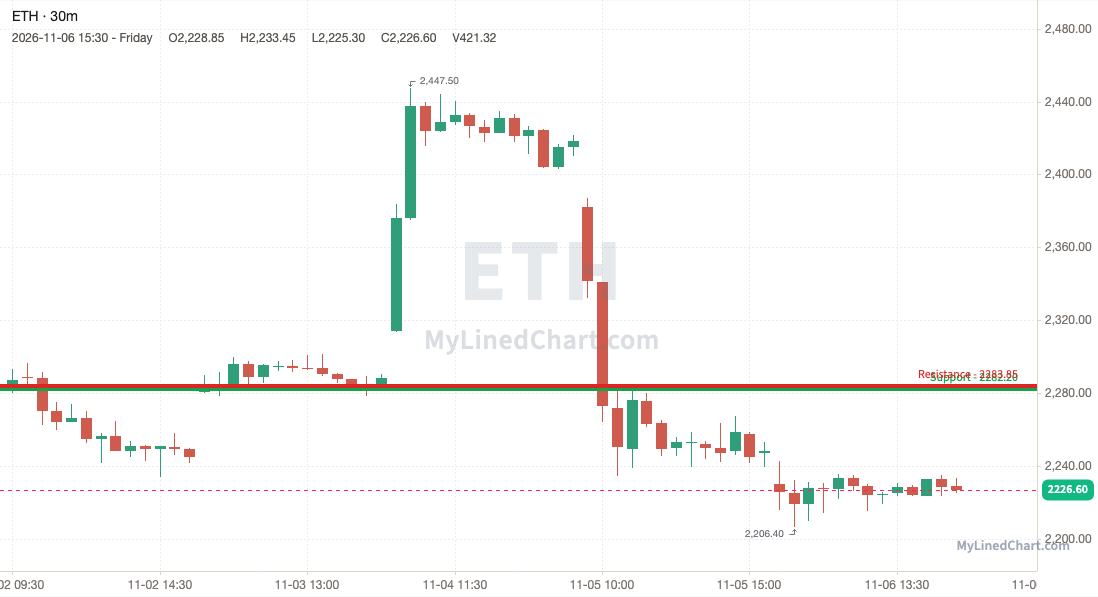
ETH broke the 2282.20 support and couldn't get back above it, closing at 2226.60, near the week's low.
Busiest levels this week:
ETH 2248.15: most volume, 1305 ETH, touched 4 times
ETH 2250.05: 2nd most, 1241 ETH, touched 15 times
ETH 2253.10: 3rd most, 867 ETH, touched 6 times
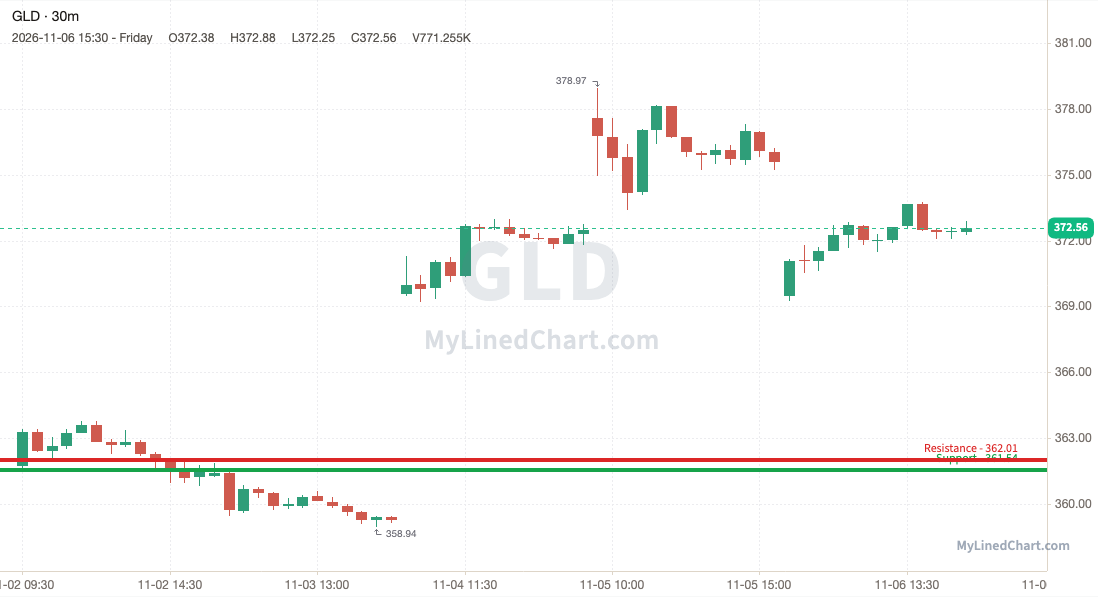
GLD (SPDR Gold Shares) +2.99%
A midweek shakeout dragged GLD down to 358.94 beneath 361.54 before it recovered the line and settled at 372.56, in the middle of its range.
Busiest levels this week:
GLD 375.64: most volume, 637865 shares, touched 20 times
GLD 365.99: 2nd most, 383947 shares, touched 13 times
GLD 365.75: 3rd most, 326952 shares, touched 6 times
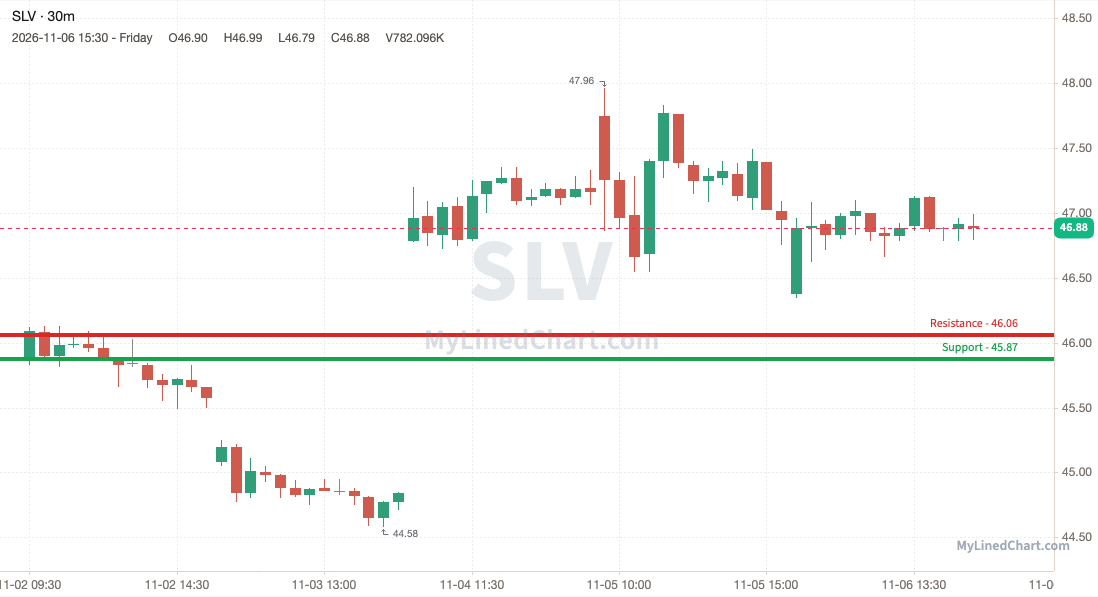
SLV (iShares Silver Trust) +2.18%
SLV dipped under 45.87 to 44.58, then bought back up to close the week at 46.88, around the middle of its weekly range.
Busiest levels this week:
SLV 48.69: most volume, 4090313 shares, touched 22 times
SLV 44.88: 2nd most, 3907903 shares, touched 5 times
SLV 47.18: 3rd most, 3481870 shares, touched 17 times
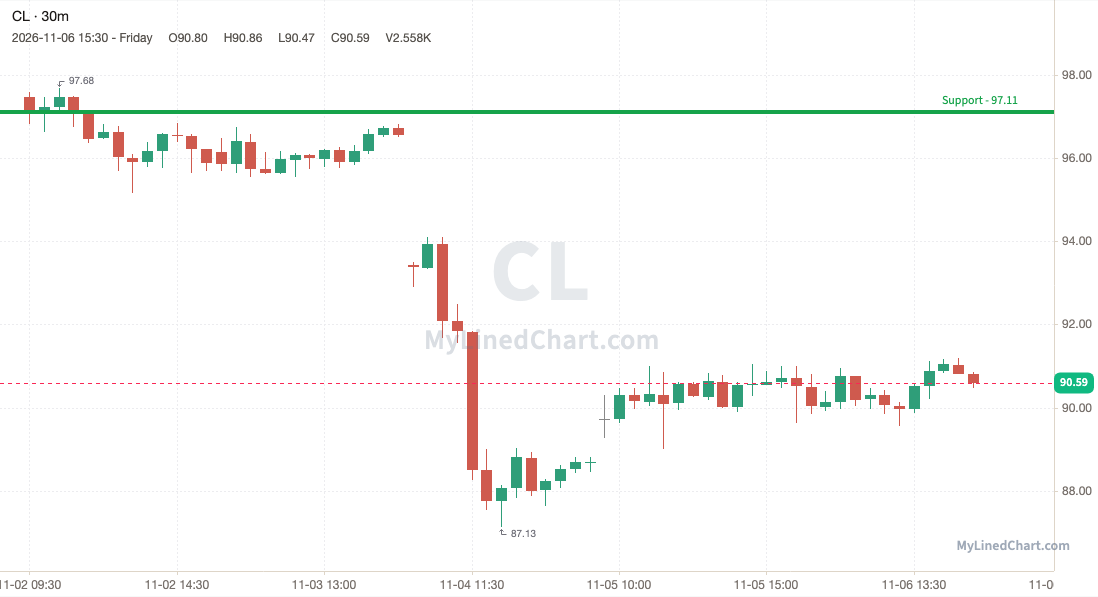
CL (Crude Oil futures) -7.06%
CL broke the 97.11 support and couldn't get back above it, closing at 90.59, mid-range for the week.
Busiest levels this week:
CL 88.98: most volume, 23500 contracts, touched 30 times
CL 91.22: 2nd most, 14415 contracts, touched 20 times
CL 96.07: 3rd most, 12061 contracts, touched 4 times
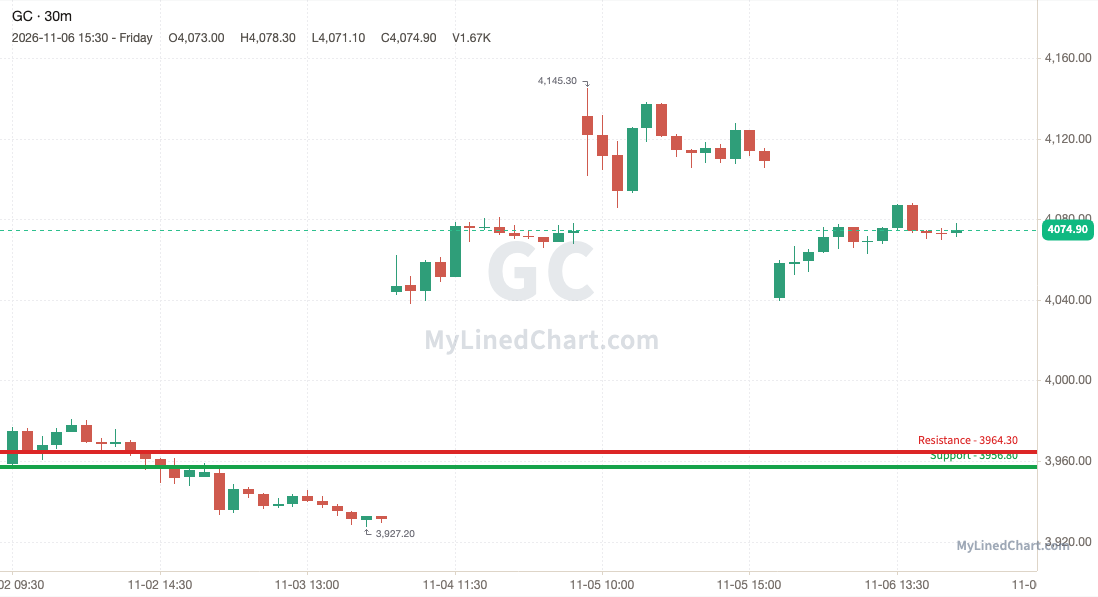
GC (Gold futures) +2.95%
GC lost 3956.80 intraday on a dip to 3927.20, but clawed it all back to finish at 4074.90, in the middle of its range.
Busiest levels this week:
GC 4080.50: most volume, 10627 contracts, touched 37 times
GC 4068: 2nd most, 6903 contracts, touched 17 times
GC 4062.90: 3rd most, 6292 contracts, touched 15 times
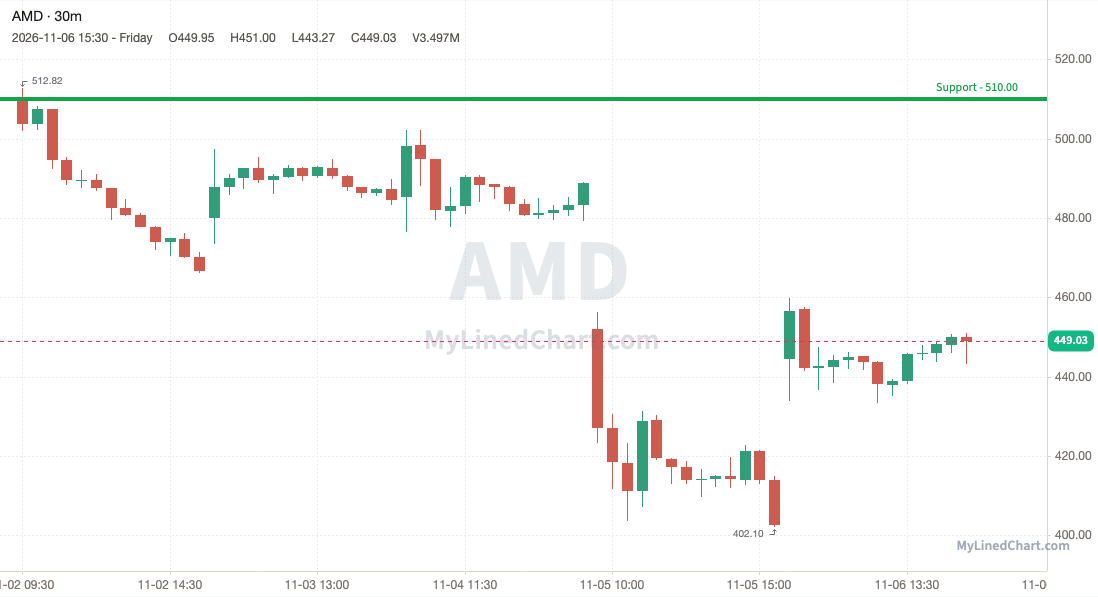
AMD (Advanced Micro Devices) -12.03%
The 510 support gave way for AMD, which closed below it at 449.03, around the middle of its weekly range.
Busiest levels this week:
AMD 488.36: most volume, 1079380 shares, touched 12 times
AMD 488.62: 2nd most, 1041848 shares, touched 4 times
AMD 488.81: 3rd most, 985042 shares, touched 8 times
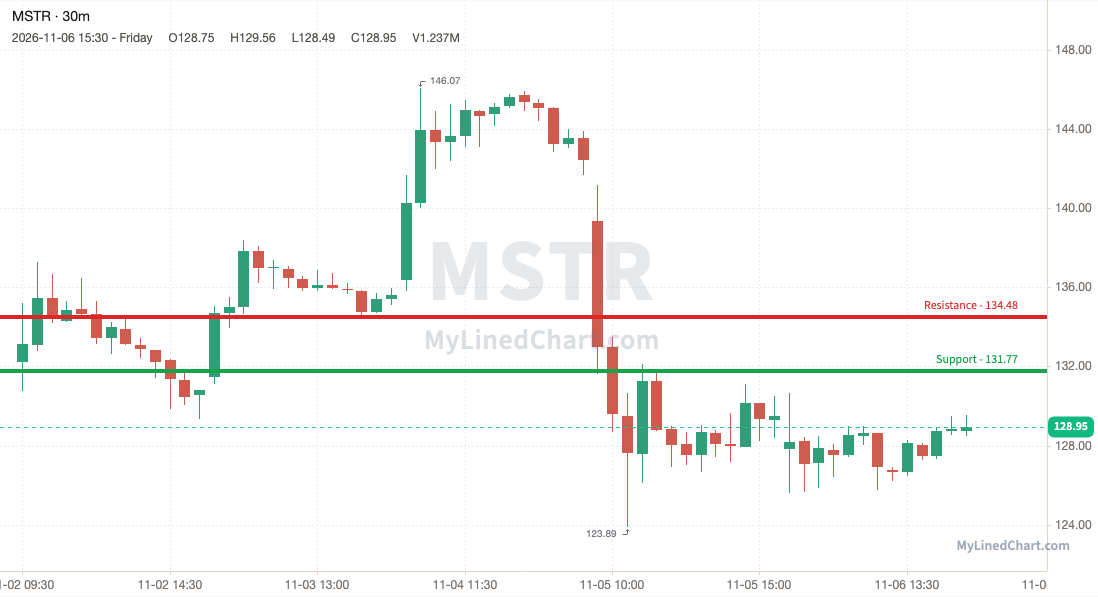
MSTR (Strategy) -2.47%
MSTR broke the 131.77 support and couldn't get back above it, closing at 128.95, mid-range for the week.
Busiest levels this week:
MSTR 130.35: most volume, 1379159 shares, touched 14 times
MSTR 135.62: 2nd most, 1362224 shares, touched 12 times
MSTR 130.56: 3rd most, 1271093 shares, touched 19 times
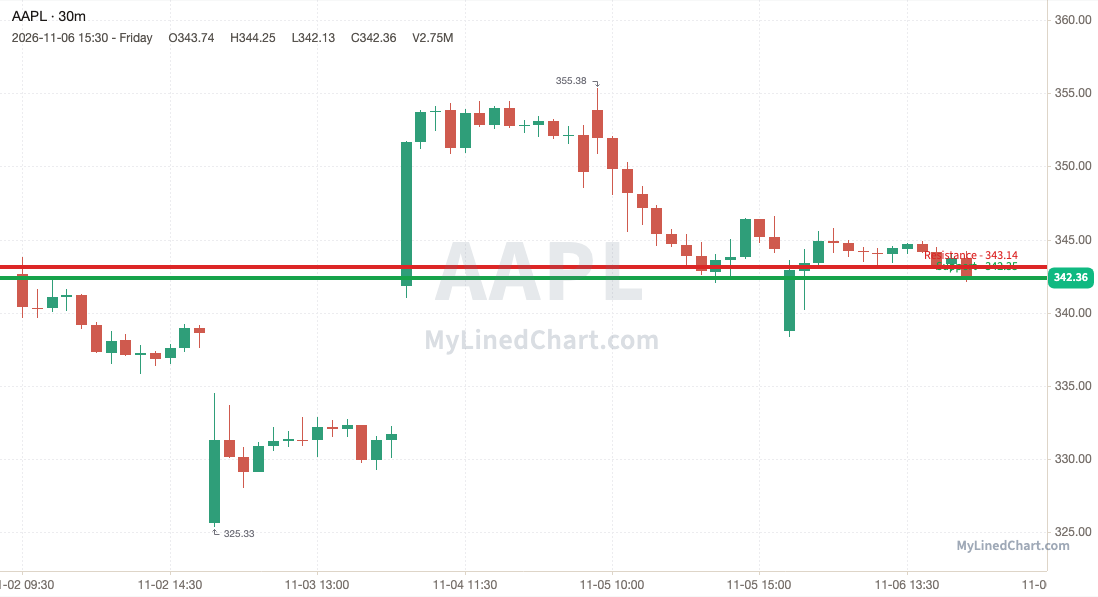
AAPL (Apple) -0.09%
Buyers had to work for it: AAPL flushed to 325.33, below the 342.35 support, then reclaimed the level and closed at 342.36, in the middle of its range.
Busiest levels this week:
AAPL 331.93: most volume, 3826541 shares, touched 4 times
AAPL 344.32: 2nd most, 3462840 shares, touched 18 times
AAPL 344.65: 3rd most, 3293222 shares, touched 28 times
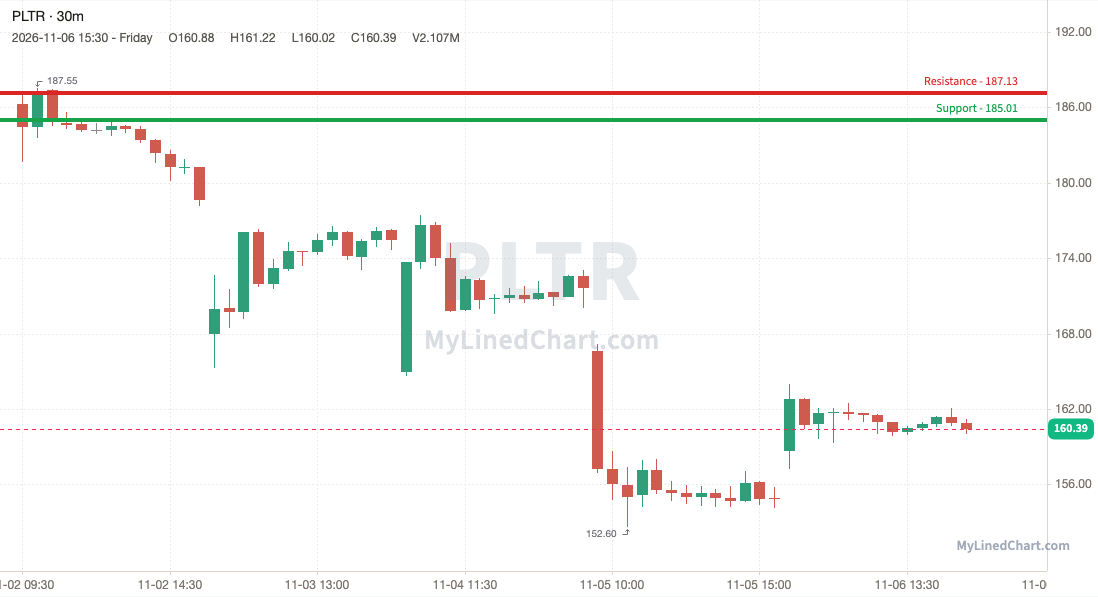
PLTR (Palantir) -13.90%
The 185.01 support gave way for PLTR, which closed below it at 160.39, around the middle of its weekly range.
Busiest levels this week:
PLTR 175.15: most volume, 4135054 shares, touched 26 times
PLTR 175.63: 2nd most, 3436986 shares, touched 21 times
PLTR 171.98: 3rd most, 2246482 shares, touched 19 times
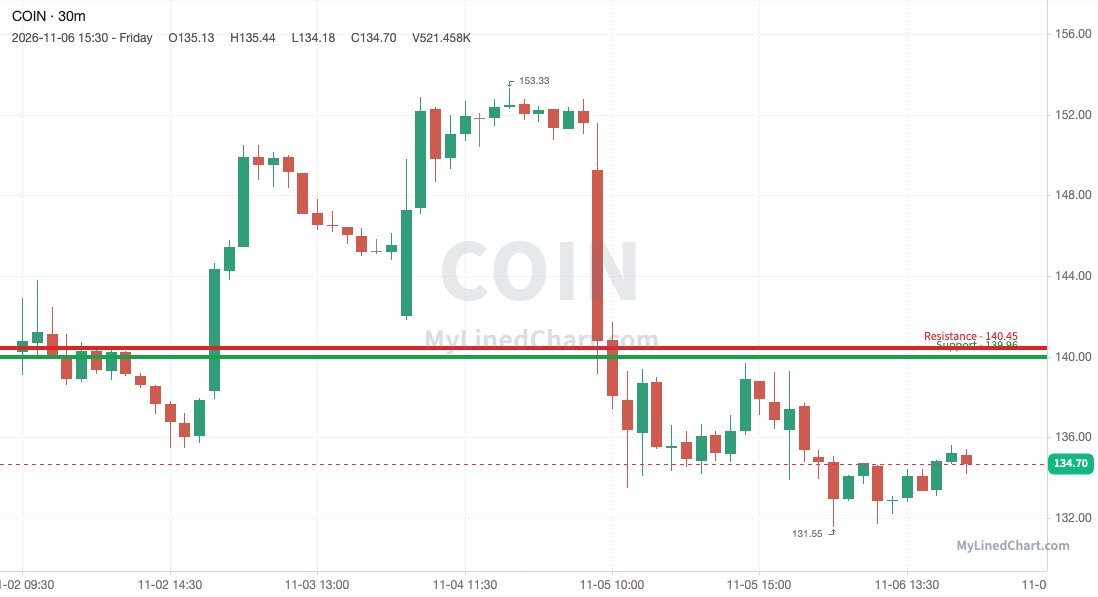
COIN (Coinbase) -3.93%
COIN broke the 139.96 support and couldn't get back above it, closing at 134.70, near the week's low.
Busiest levels this week:
COIN 151.46: most volume, 617220 shares, touched 17 times
COIN 151.63: 2nd most, 575653 shares, touched 22 times
COIN 151.28: 3rd most, 565520 shares, touched 19 times
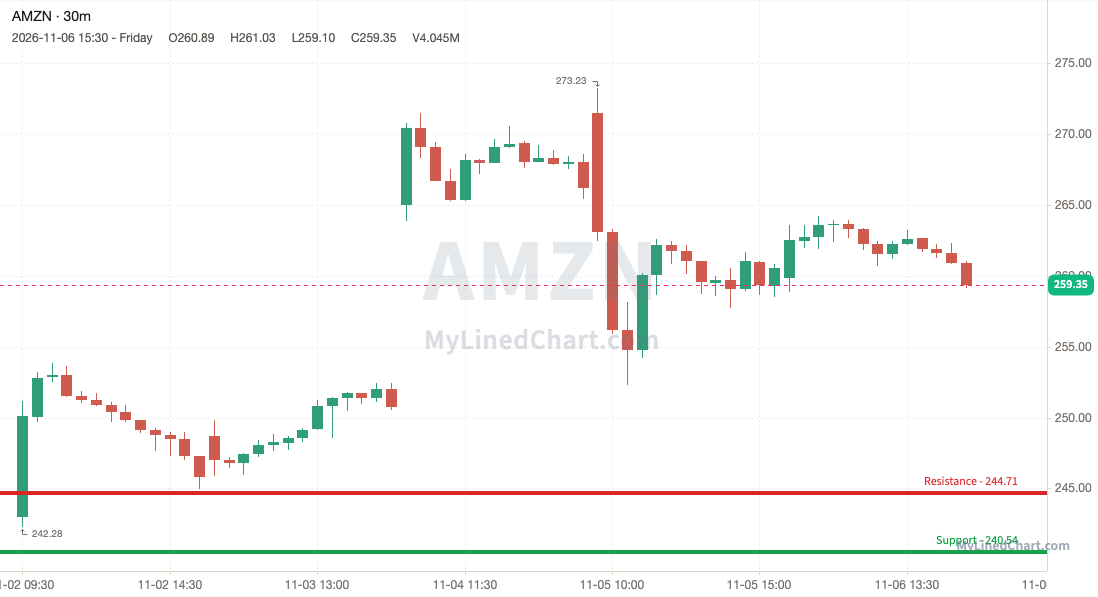
AMZN (Amazon) +6.72%
AMZN stayed above 240.54 the whole way and finished at 259.35, in the middle of its range.
Busiest levels this week:
AMZN 240.26: most volume, 2900432 shares, touched 18 times
AMZN 250.97: 2nd most, 2587690 shares, touched 3 times
AMZN 250.51: 3rd most, 2373879 shares, touched 23 times
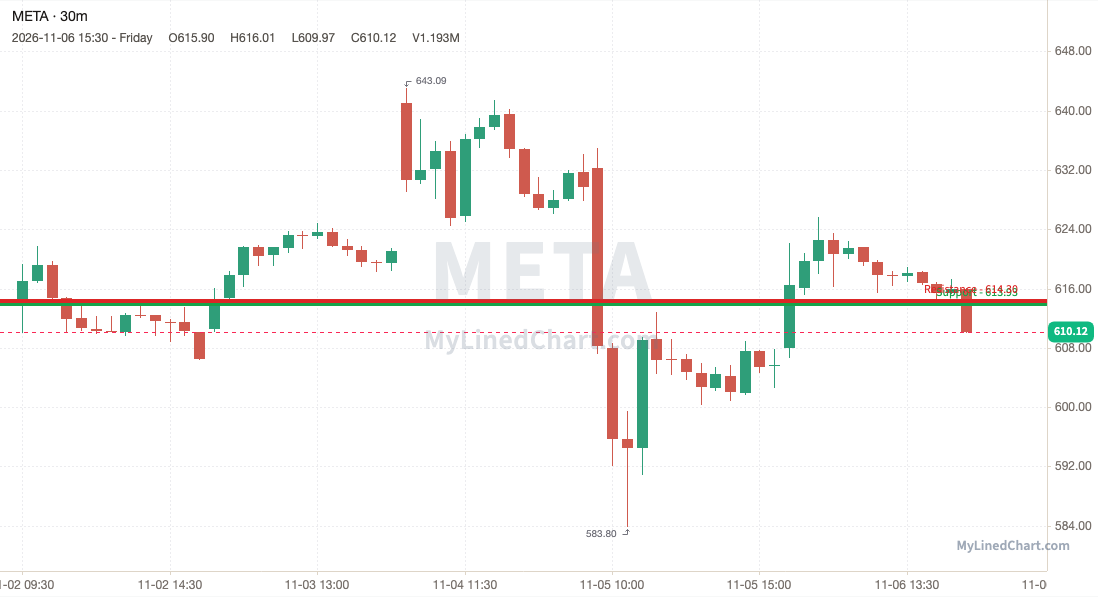
META (Meta Platforms) -0.68%
The 613.93 support gave way for META, which closed below it at 610.12, around the middle of its weekly range.
Busiest levels this week:
META 614.69: most volume, 872394 shares, touched 5 times
META 615: 2nd most, 833089 shares, touched 23 times
META 606.51: 3rd most, 760193 shares, touched 7 times
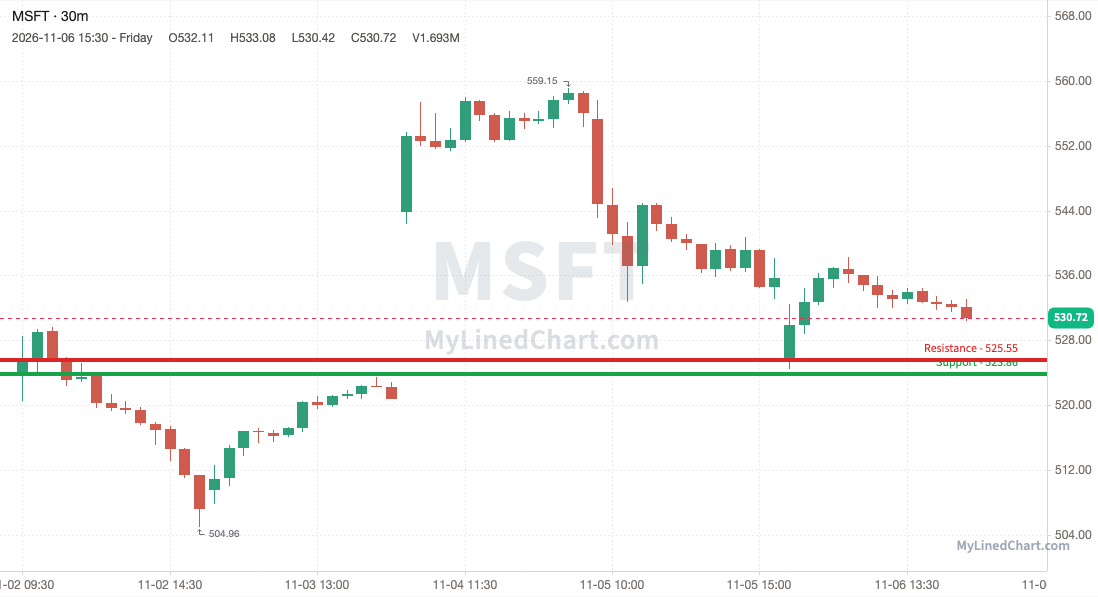
MSFT (Microsoft) +1.28%
MSFT lost 523.86 intraday on a dip to 504.96, but clawed it all back to finish at 530.72, mid-range for the week.
Busiest levels this week:
MSFT 508.29: most volume, 582524 shares, touched 8 times
MSFT 505.99: 2nd most, 464624 shares, touched 4 times
MSFT 521.45: 3rd most, 452867 shares, touched 4 times
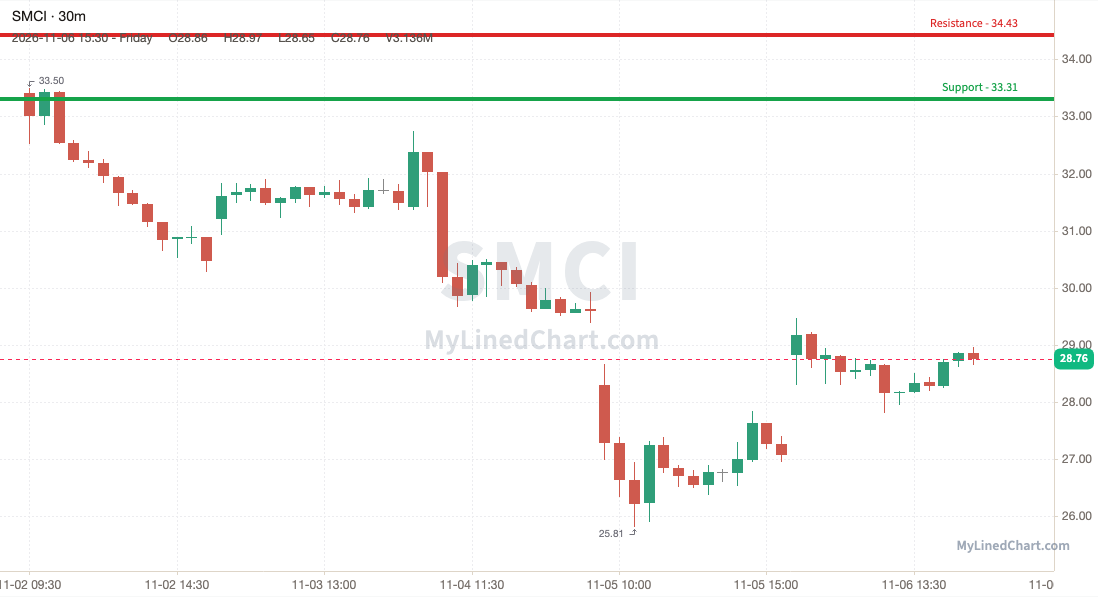
SMCI (Super Micro Computer) -13.92%
SMCI lost 33.31 and stayed under it, ending the week at 28.76, in the middle of its range.
Busiest levels this week:
SMCI 29.37: most volume, 17040884 shares, touched 31 times
SMCI 30.34: 2nd most, 16850935 shares, touched 50 times
SMCI 30.66: 3rd most, 15822524 shares, touched 56 times
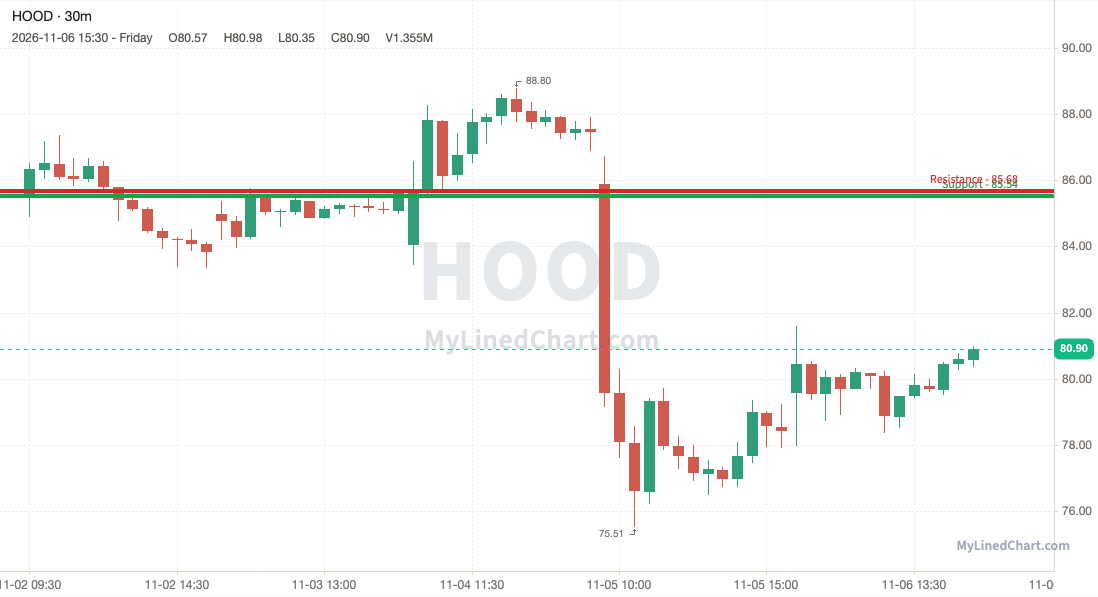
HOOD (Robinhood) -5.45%
The 85.54 support gave way for HOOD, which closed below it at 80.90, around the middle of its weekly range.
Busiest levels this week:
HOOD 87.27: most volume, 2908067 shares, touched 23 times
HOOD 83.66: 2nd most, 1895356 shares, touched 14 times
HOOD 83.54: 3rd most, 1847789 shares, touched 9 times
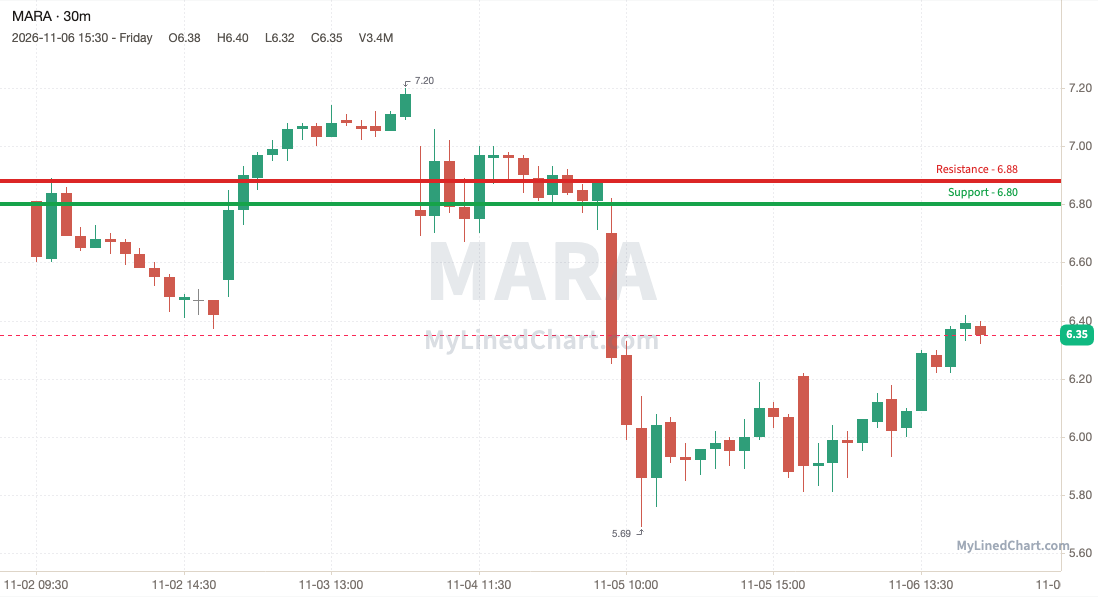
MARA (MARA Holdings) -6.75%
MARA broke the 6.80 support and couldn't get back above it, closing at 6.35, mid-range for the week.
Busiest levels this week:
MARA 7.03: most volume, 18838502 shares, touched 39 times
MARA 6.81: 2nd most, 12829180 shares, touched 26 times
MARA 7.64: 3rd most, 12266797 shares, touched 30 times
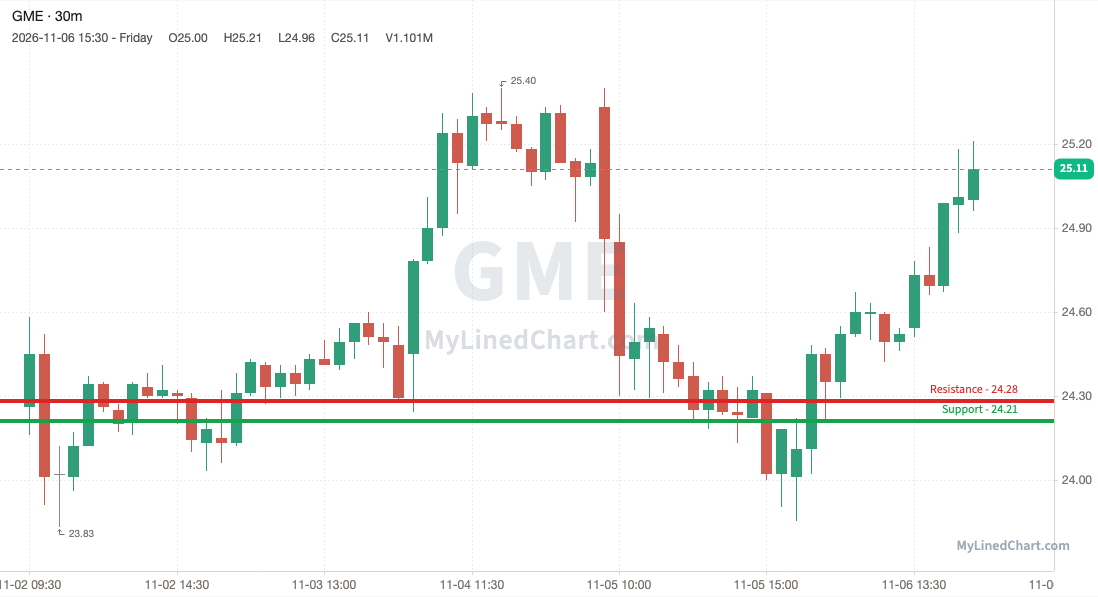
GME (GameStop) +3.50%
GME lost 24.21 intraday on a dip to 23.83, but clawed it all back to finish at 25.11, just off the highs.
Busiest levels this week:
GME 24.74: most volume, 3594932 shares, touched 42 times
GME 24.73: 2nd most, 3475156 shares, touched 42 times
GME 24.59: 3rd most, 3380088 shares, touched 57 times
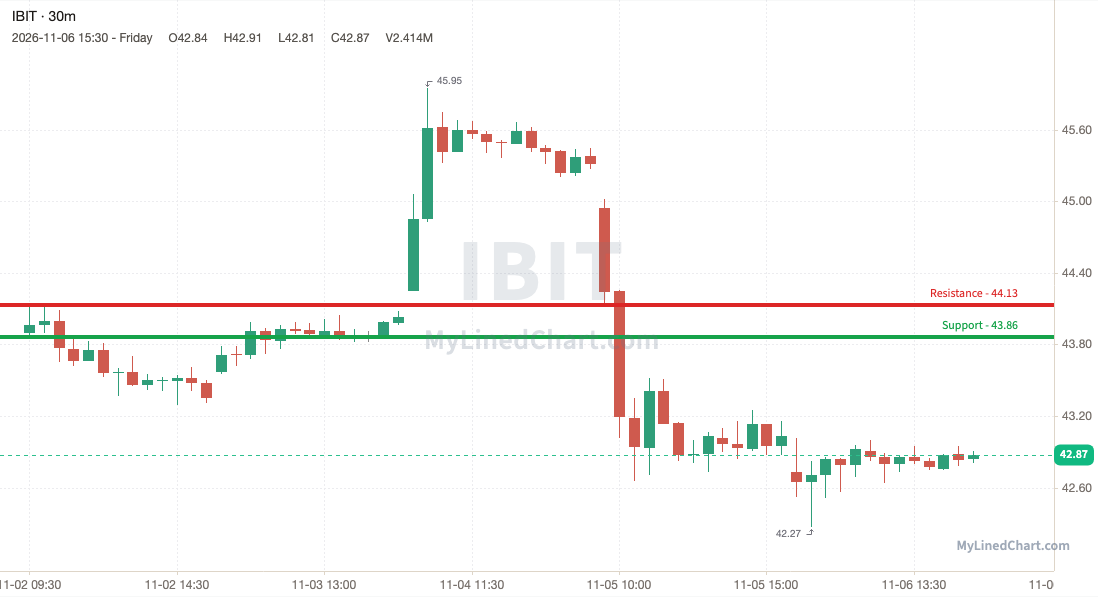
IBIT (iShares Bitcoin Trust) -2.35%
The 43.86 support gave way for IBIT, which closed below it at 42.87, at the bottom of its weekly range.
Busiest levels this week:
IBIT 43.43: most volume, 12279320 shares, touched 14 times
IBIT 43.36: 2nd most, 10099283 shares, touched 12 times
IBIT 43.52: 3rd most, 10050957 shares, touched 18 times
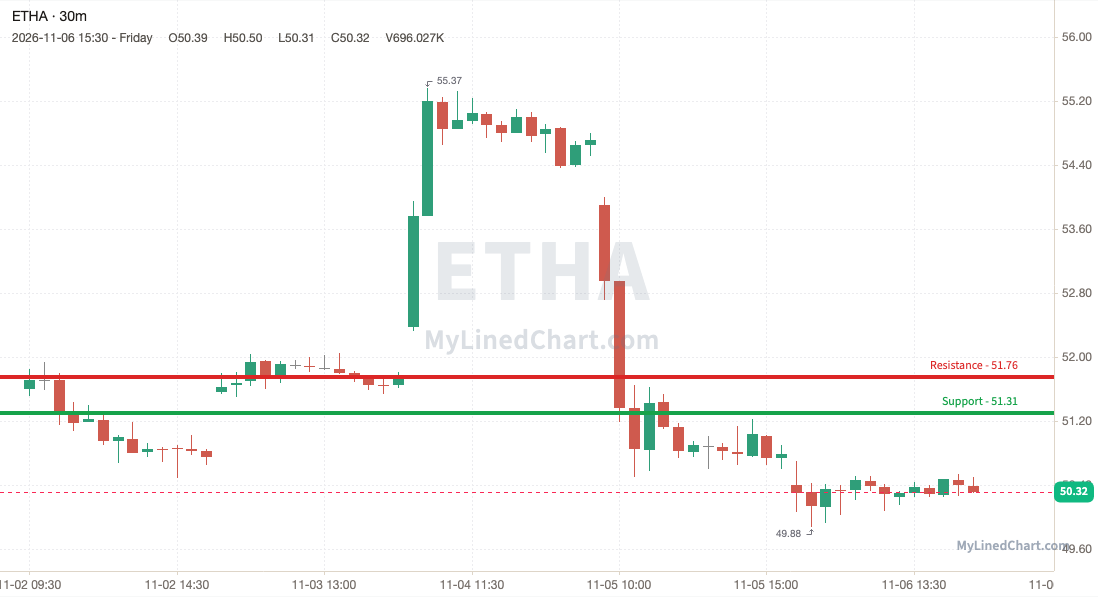
ETHA (iShares Ethereum Trust) -2.48%
ETHA broke the 51.31 support and couldn't get back above it, closing at 50.32, near the week's low.
Busiest levels this week:
ETHA 50.82: most volume, 1955874 shares, touched 16 times
ETHA 54.35: 2nd most, 1542213 shares, touched 33 times
ETHA 48.37: 3rd most, 1383798 shares, touched 21 times
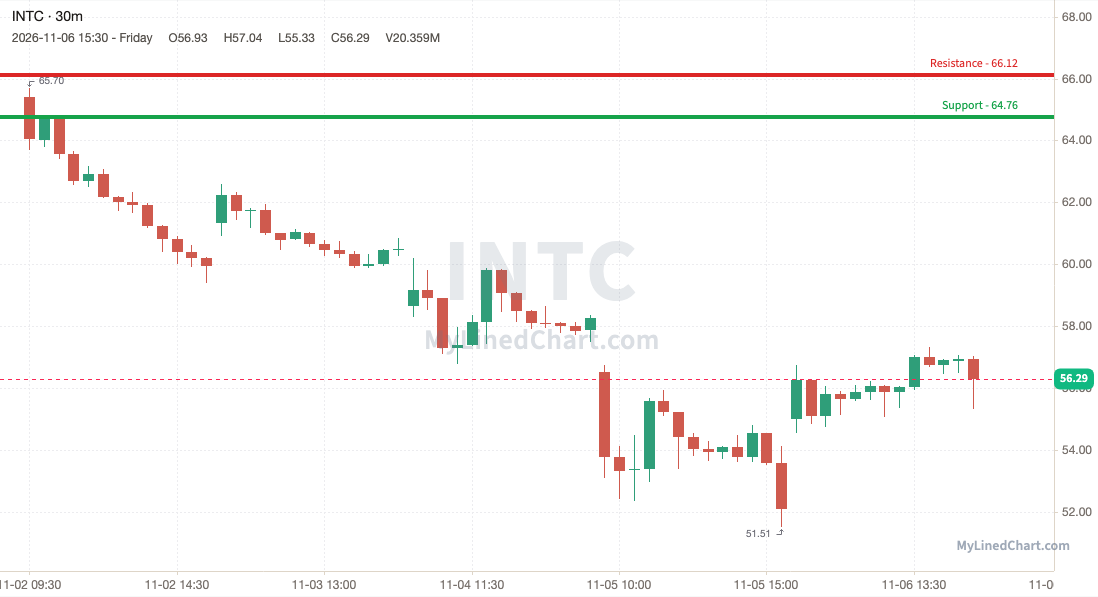
INTC (Intel) -13.92%
INTC lost 64.76 and stayed under it, ending the week at 56.29, in the middle of its range.
Busiest levels this week:
INTC 53.78: most volume, 6937722 shares, touched 5 times
INTC 63.69: 2nd most, 6768640 shares, touched 5 times
INTC 60.33: 3rd most, 5803346 shares, touched 3 times
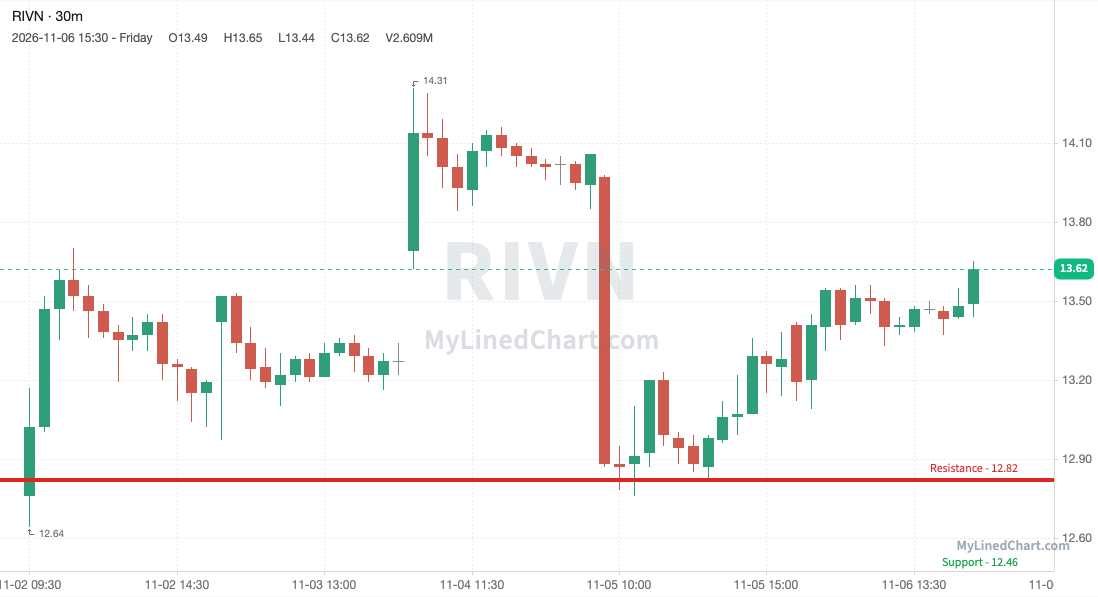
RIVN (Rivian) +6.74%
Support did its job for RIVN: 12.46 held cleanly and it closed at 13.62, around the middle of its weekly range.
Busiest levels this week:
RIVN 11.65: most volume, 17858709 shares, touched 49 times
RIVN 14.22: 2nd most, 17204399 shares, touched 45 times
RIVN 11.80: 3rd most, 10923921 shares, touched 25 times
See the Active Traders trade plan
Touches show how often traders defended a price; each test can wear it down. Volume shows how much trading happened there, and heavy-volume prices tend to pull price back because many traders hold positions there.
Levels for the week ahead
SPY
SPY closed the week at 735.35. For the week ahead the weekly pivot is 747.90, with R1 at 763.09 and S1 at 720.16. Last week's range ran from 732.71 to 775.64.
| Weekly level | Price | From the close |
|---|---|---|
| Last week high | 775.64 | +40.29 |
| Weekly R1 | 763.09 | +27.74 |
| Weekly pivot | 747.90 | +12.55 |
| Last week low | 732.71 | -2.64 |
| Weekly S1 | 720.16 | -15.19 |
ES
ES closed the week at 7405.75. For the week ahead the weekly pivot is 7499.08, with R1 at 7653.17 and S1 at 7251.67. Last week's range ran from 7345 to 7746.50.
| Weekly level | Price | From the close |
|---|---|---|
| Last week high | 7746.50 | +340.75 |
| Weekly R1 | 7653.17 | +247.42 |
| Weekly pivot | 7499.08 | +93.33 |
| Last week low | 7345 | -60.75 |
| Weekly S1 | 7251.67 | -154.08 |
QQQ
QQQ closed the week at 656.19. For the week ahead the weekly pivot is 668.25, with R1 at 689.39 and S1 at 635.06. Last week's range ran from 647.12 to 701.45.
| Weekly level | Price | From the close |
|---|---|---|
| Last week high | 701.45 | +45.26 |
| Weekly R1 | 689.39 | +33.20 |
| Weekly pivot | 668.25 | +12.06 |
| Last week low | 647.12 | -9.07 |
| Weekly S1 | 635.06 | -21.13 |
NQ
NQ closed the week at 27107.50. For the week ahead the weekly pivot is 27550, with R1 at 28528.25 and S1 at 26129.25. Last week's range ran from 26571.75 to 28970.75.
| Weekly level | Price | From the close |
|---|---|---|
| Last week high | 28970.75 | +1863.25 |
| Weekly R1 | 28528.25 | +1420.75 |
| Weekly pivot | 27550 | +442.50 |
| Last week low | 26571.75 | -535.75 |
| Weekly S1 | 26129.25 | -978.25 |
US market calendar for the week of November 9 to 13
The US calendar for the week of November 9 to 13: 2 scheduled events, all times ET.
Tuesday, November 10
- 8:30 AM ET: CPI for October (BLS)
Friday, November 13
- 8:30 AM ET: PPI for October (BLS)
See the latest daily SPY, ES, QQQ & NQ levels, posted the evening before the next day's session.
MyLinedChart turns your technical analysis into trading rules. Draw your levels, export your entire chart to XLSX, and turn your rules into trades. Or, have Claude, Codex, or Cursor do the work for you.
Not financial advice. Objective market structure and levels only. You make and own your trades.